Hybrid Scenario Benchmark
The Hybrid Scenario Benchmark is designed for the SkyWalking OAP to evaluate typical full‑stack observability scenarios. It generates metrics, logs, and traces in proportional ratios, and conducts performance tests under various cluster scales and sampling rates. The goal is to simulate and reproduce real‑world production performance characteristics and resource consumption.
Version Information
- BanyanDB Version: 0.9.0
- Commit: a2479b1c7dd805b74bffbc5f9317da9df6ac95a5
Minimal specification Test Environment
This small specification benchmark was conducted on a Kubernetes cluster with a single node (16 cores, 64GB RAM), deploying a complete BanyanDB cluster with lifecycle support using the skywalking-banyandb-helm chart. Each BanyanDB Pod is configured with resource limits of 2 cores and 4GB memory.
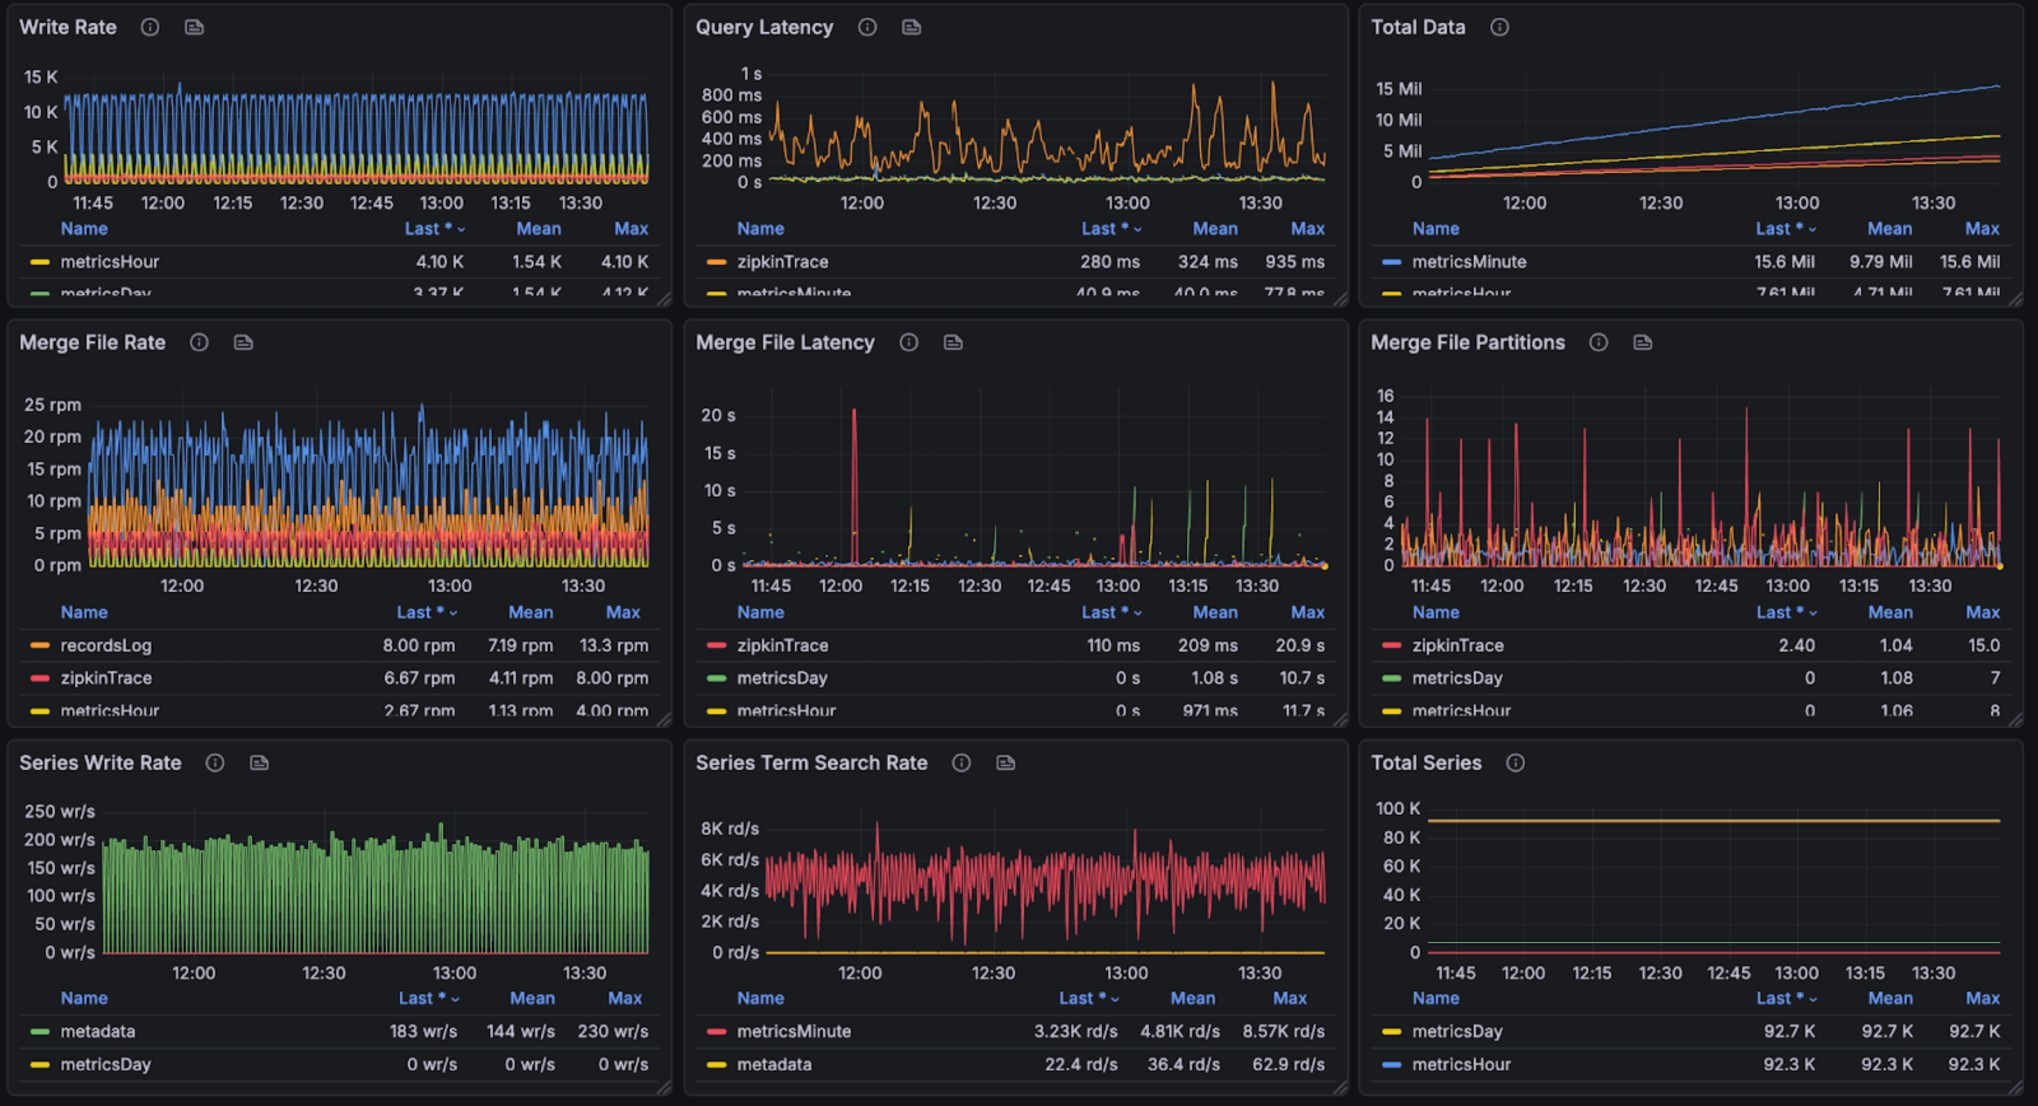
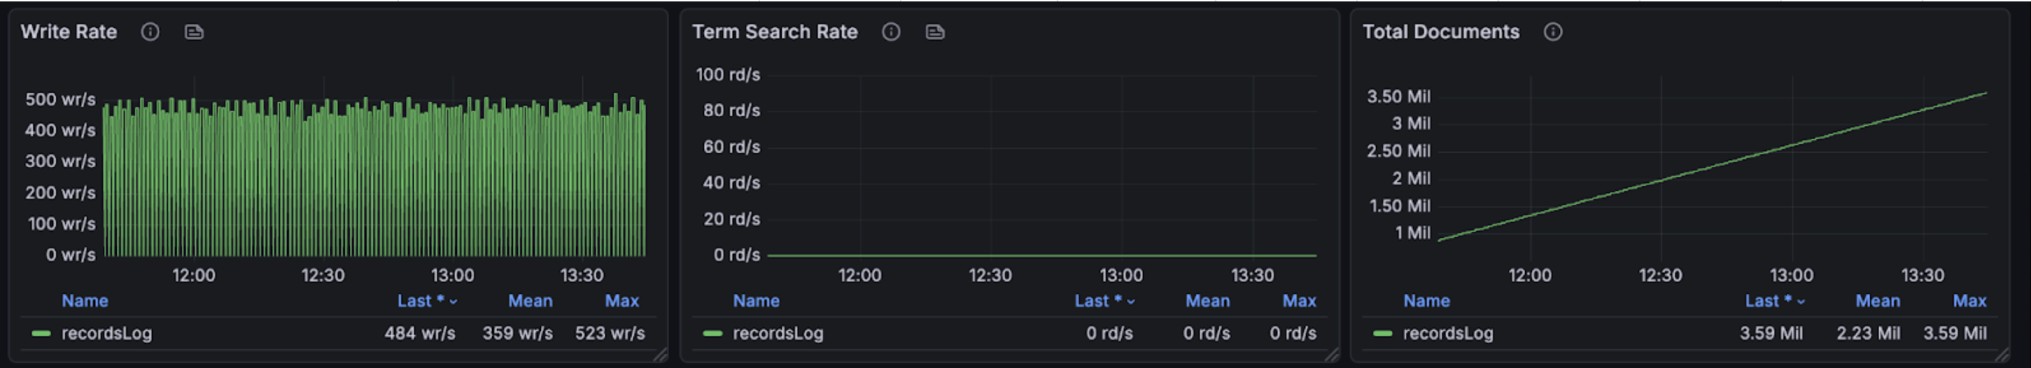
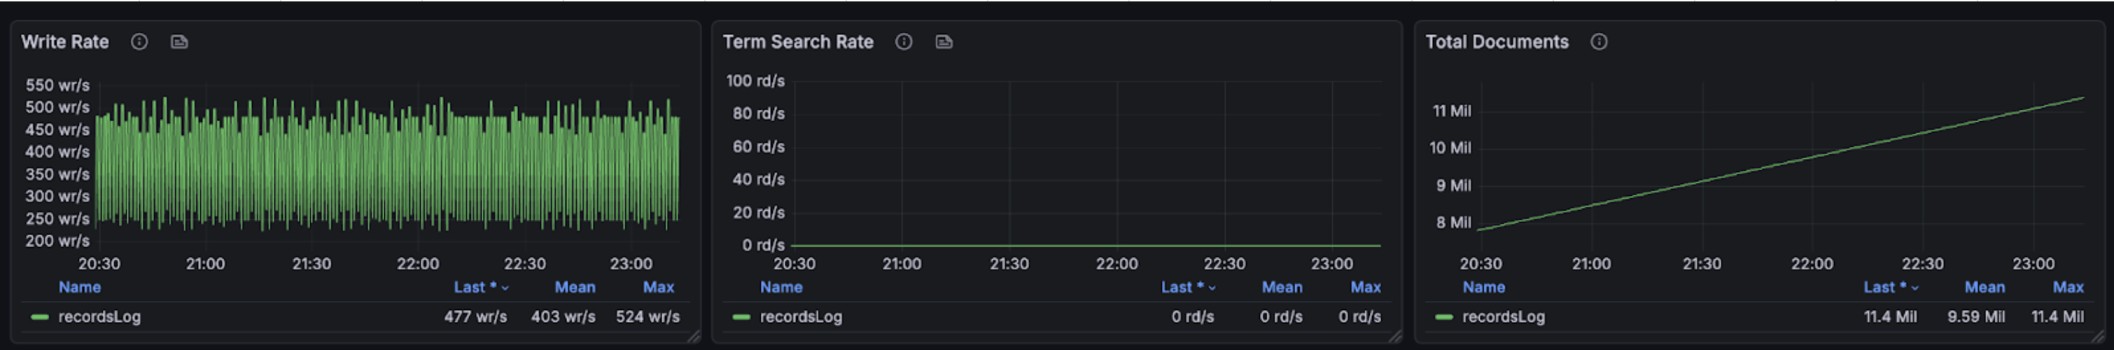
Write
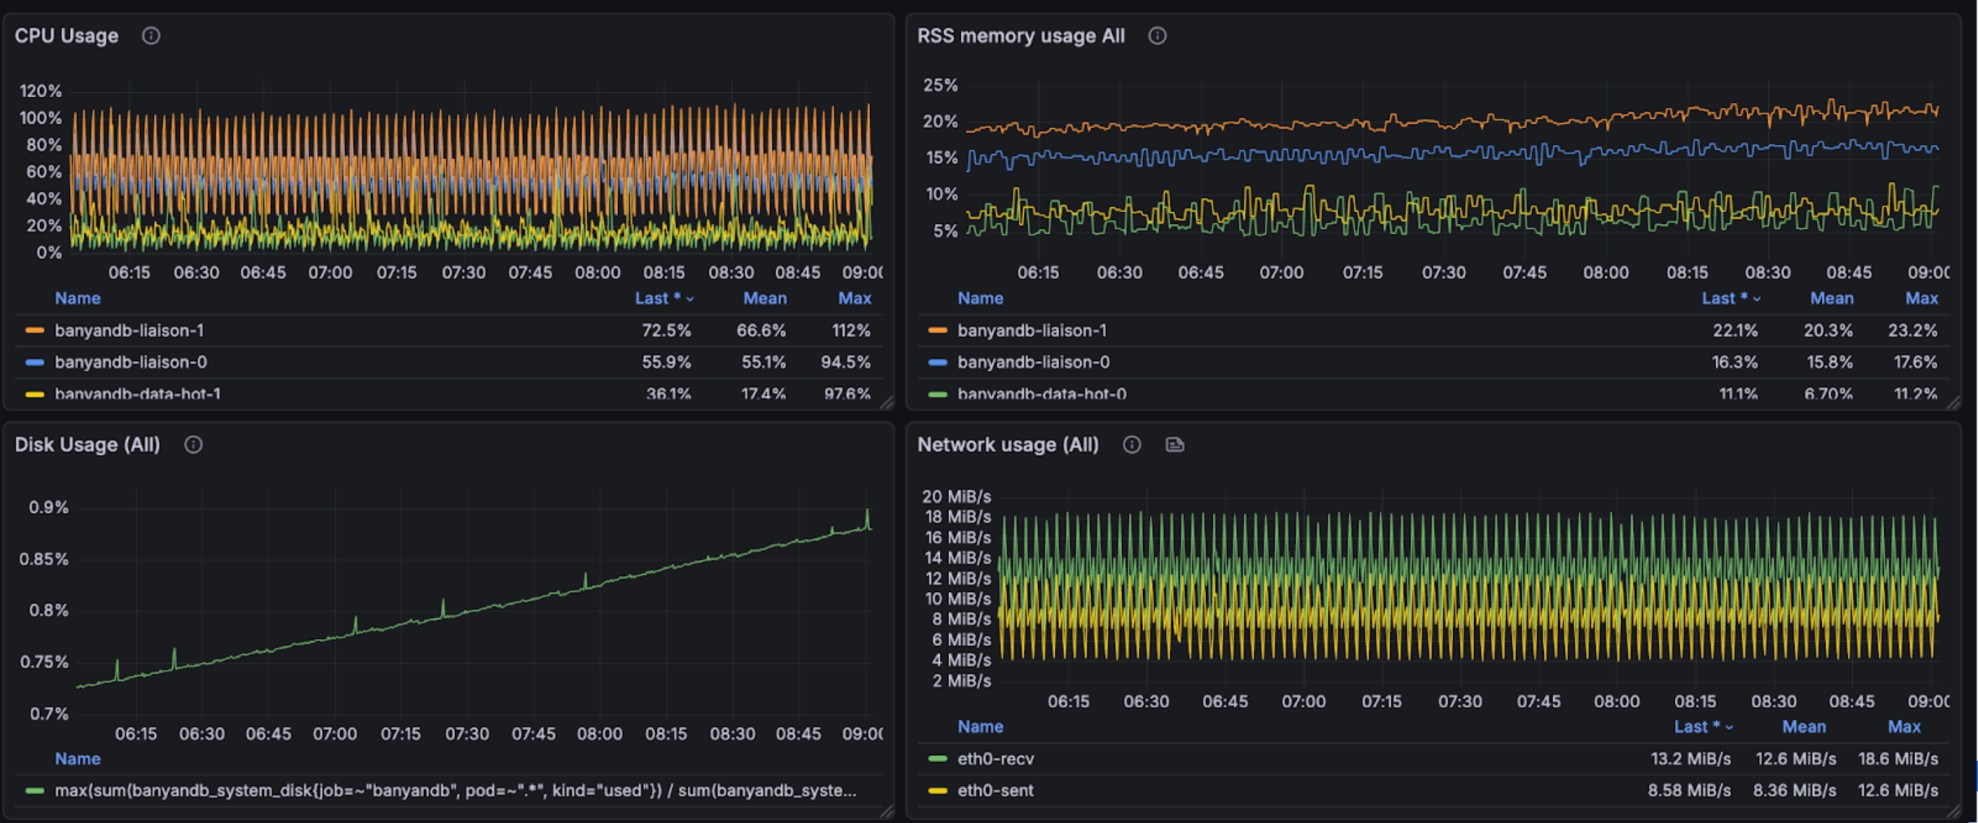
The test involves 426 services, 2,820 instances, and 4,500 endpoints. These entities produce over 21,600 logs per minute, write 26640 spans per minute(max 4000 spans per second). 1.178g disk volume in 2 hours for all telemetry data, 0.85g disk volume in 2 hours for trace. It should takes over ~100g dist volume in 7 days for all telemetry, and ~75g in 7 days for trace.
The following graphs illustrate the resource usage during write operations, showing CPU and memory consumption across the BanyanDB cluster:
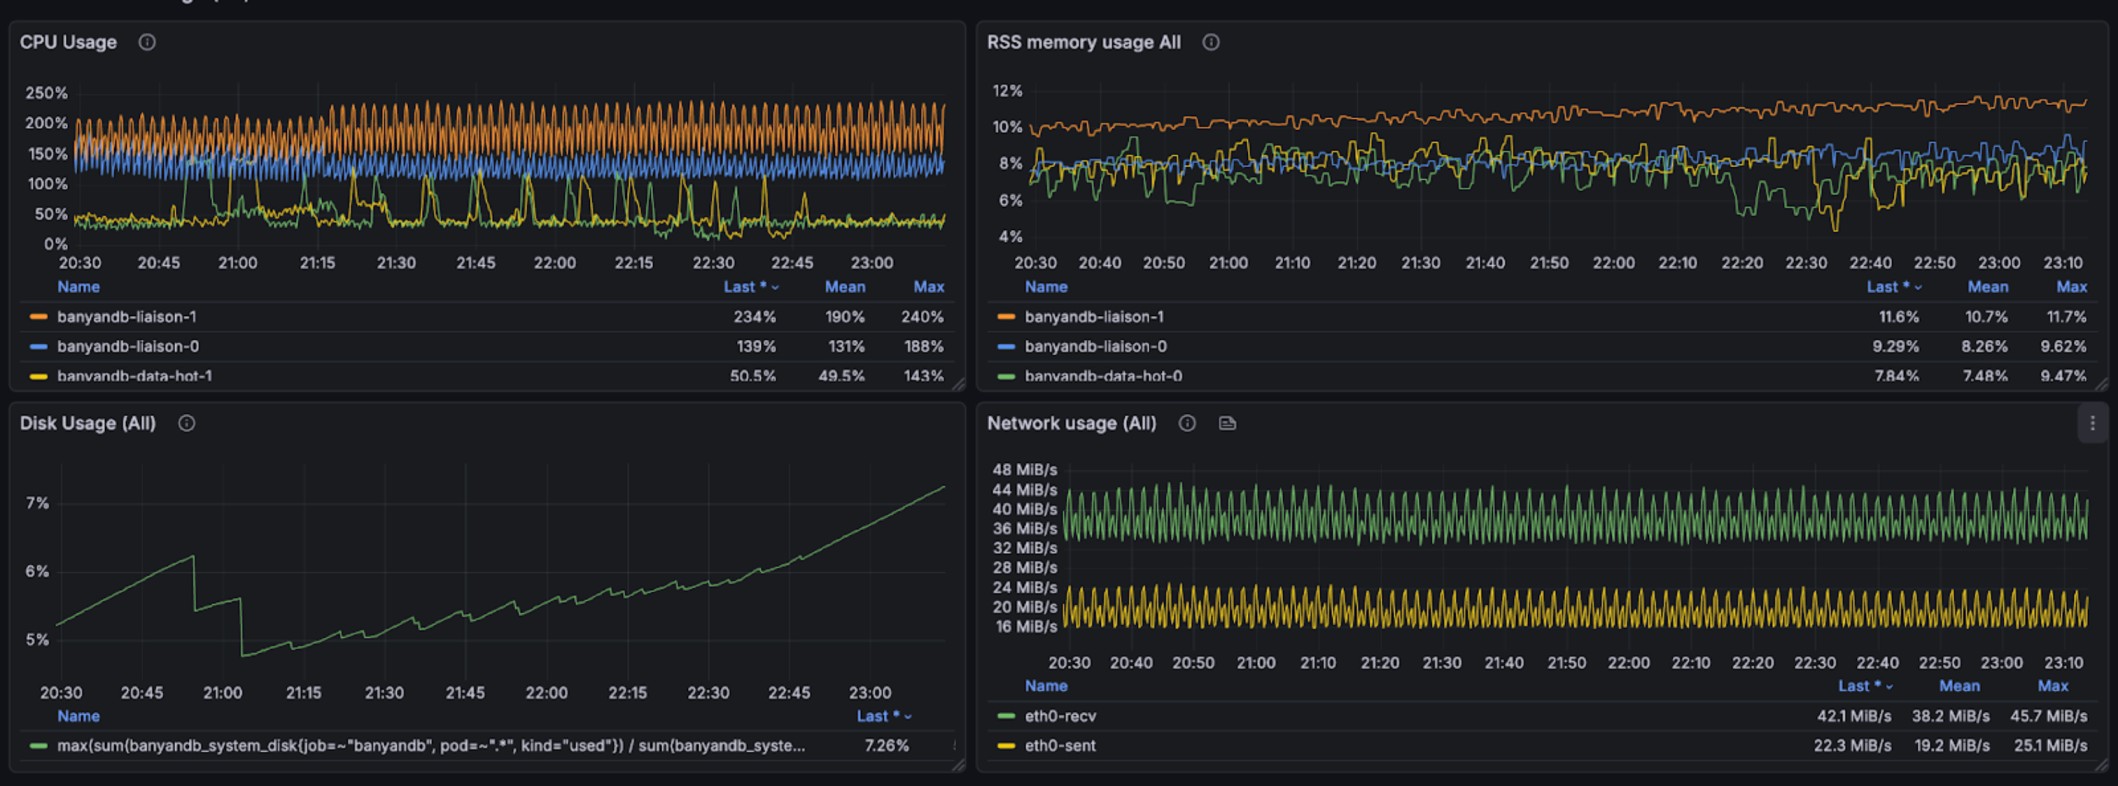
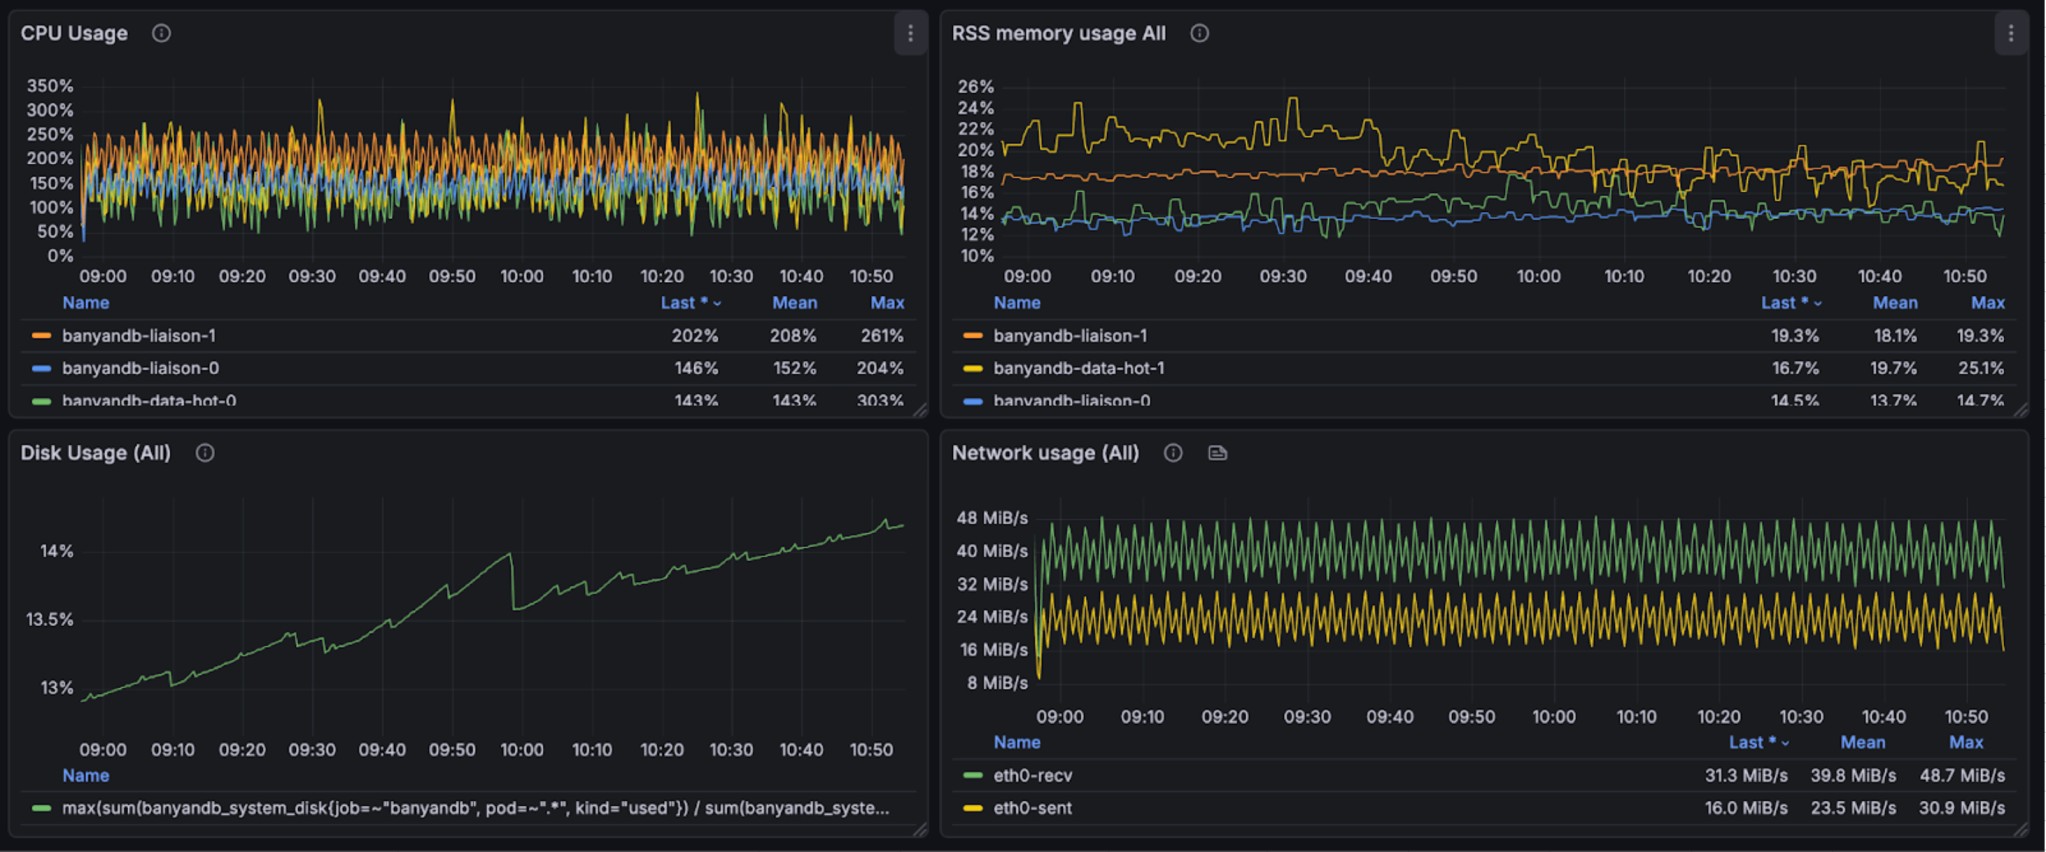
Read
During query and writing, it takes 200% CPU, 26% avg, 35% peak memory cost(total 4g). Note, other parts are used by OS Page Cache. We don’t have measurement to check the efficiency of that.
The query performance metrics per request are as follows:
- Log Query Performance: min,max,mean,median,p90,p95,p98,p99 duration(millisecond): 3.977926, 368.129126, 58.283439, 46.903162, 114.155032, 152.219269, 190.683562, 271.887189
- Trace Query Performance: min,max,mean,median,p90,p95,p98,p99 duration(millisecond): 40.465124, 1223.494809, 337.795821, 305.647714, 610.154281, 703.630915, 905.547645, 988.851445
- Metrics query in major dashboards are good.
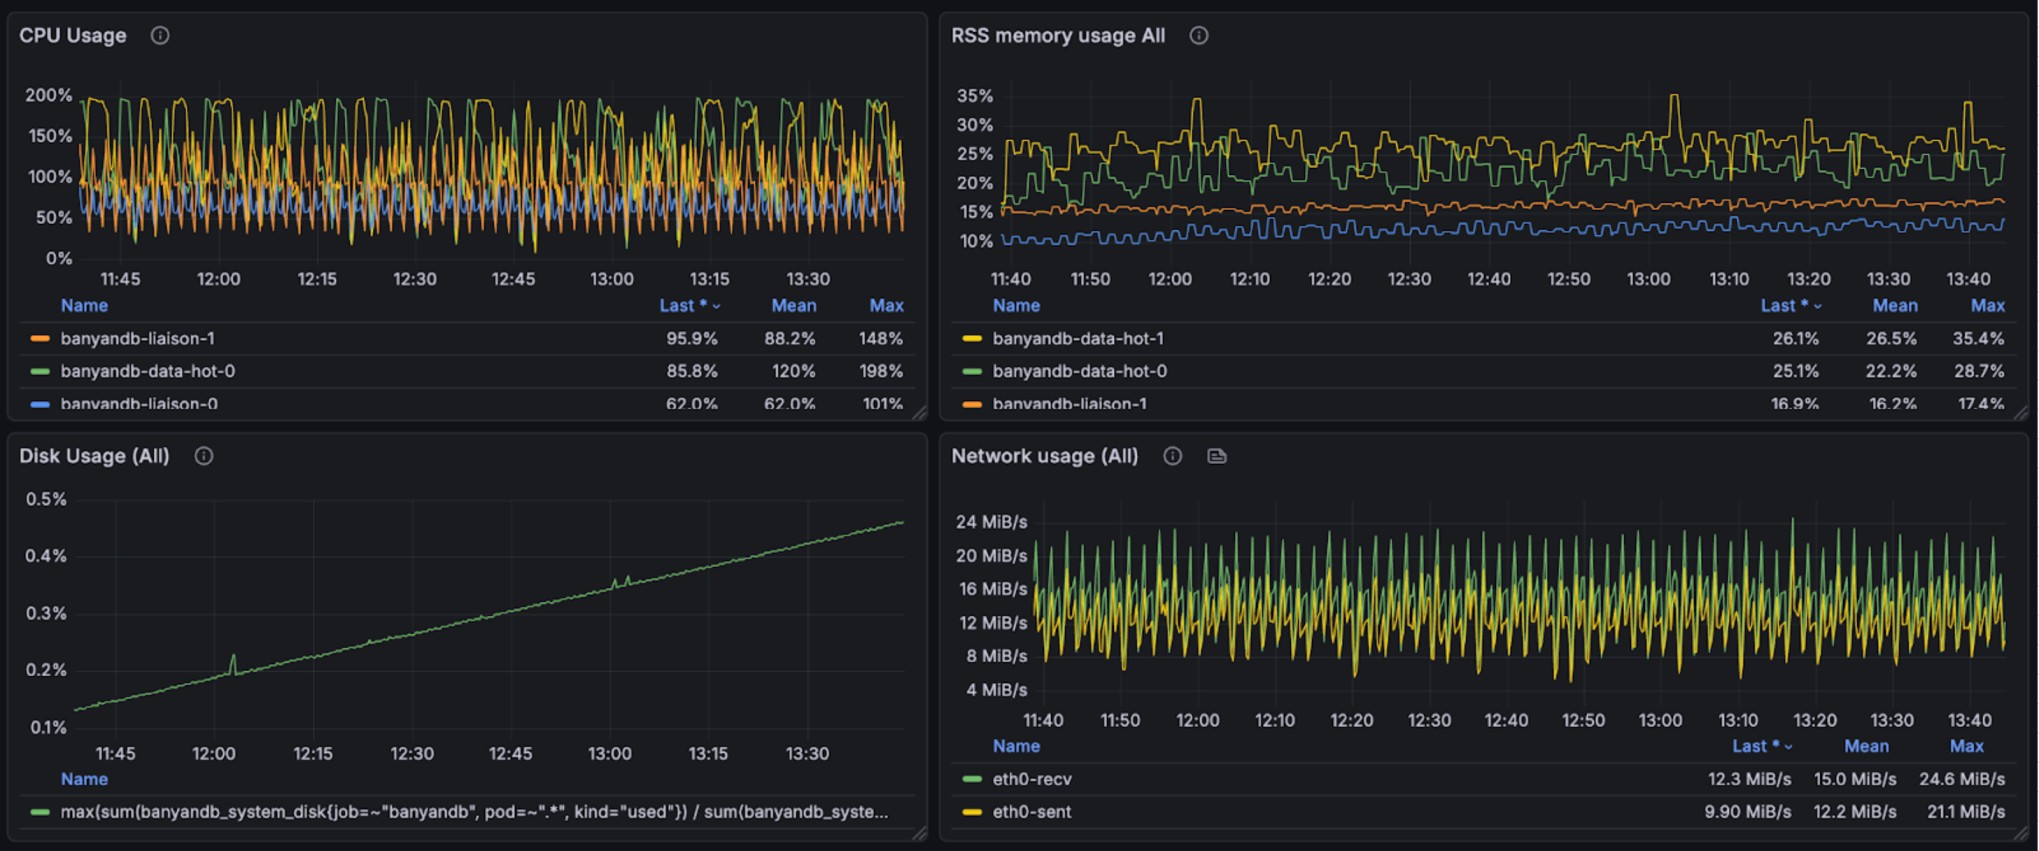
The graphs below show resource utilization during combined read and write operations, demonstrating BanyanDB’s ability to handle concurrent workloads:
Standard specification Test Environment
This Standard specification benchmark was conducted on a Kubernetes cluster with a single node (32 cores, 128GB RAM), deploying a complete BanyanDB cluster with lifecycle support using the skywalking-banyandb-helm chart. Similar to the small specification configuration, except that in the standard specification setup, both the liaison and data nodes have been upgraded from 2 cores and 4GB memory to 4 cores and 8GB memory.
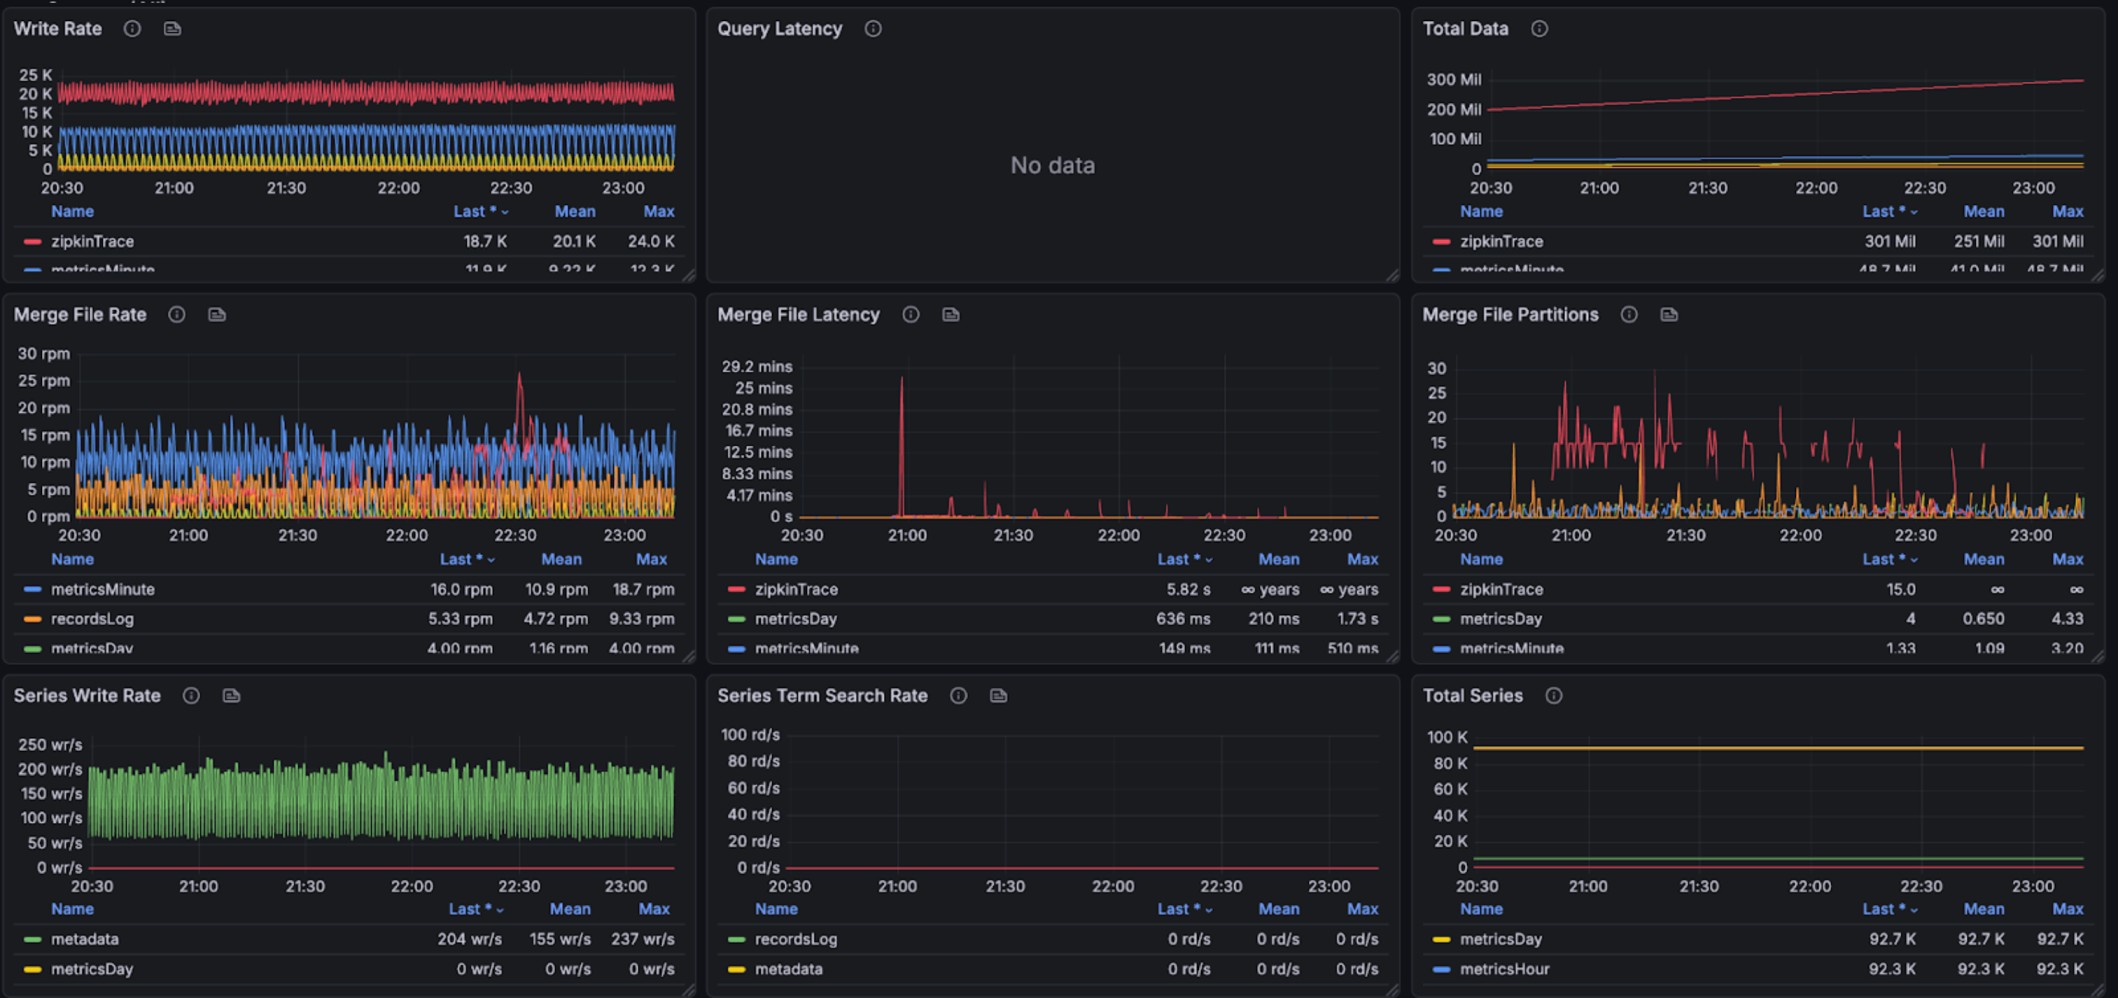
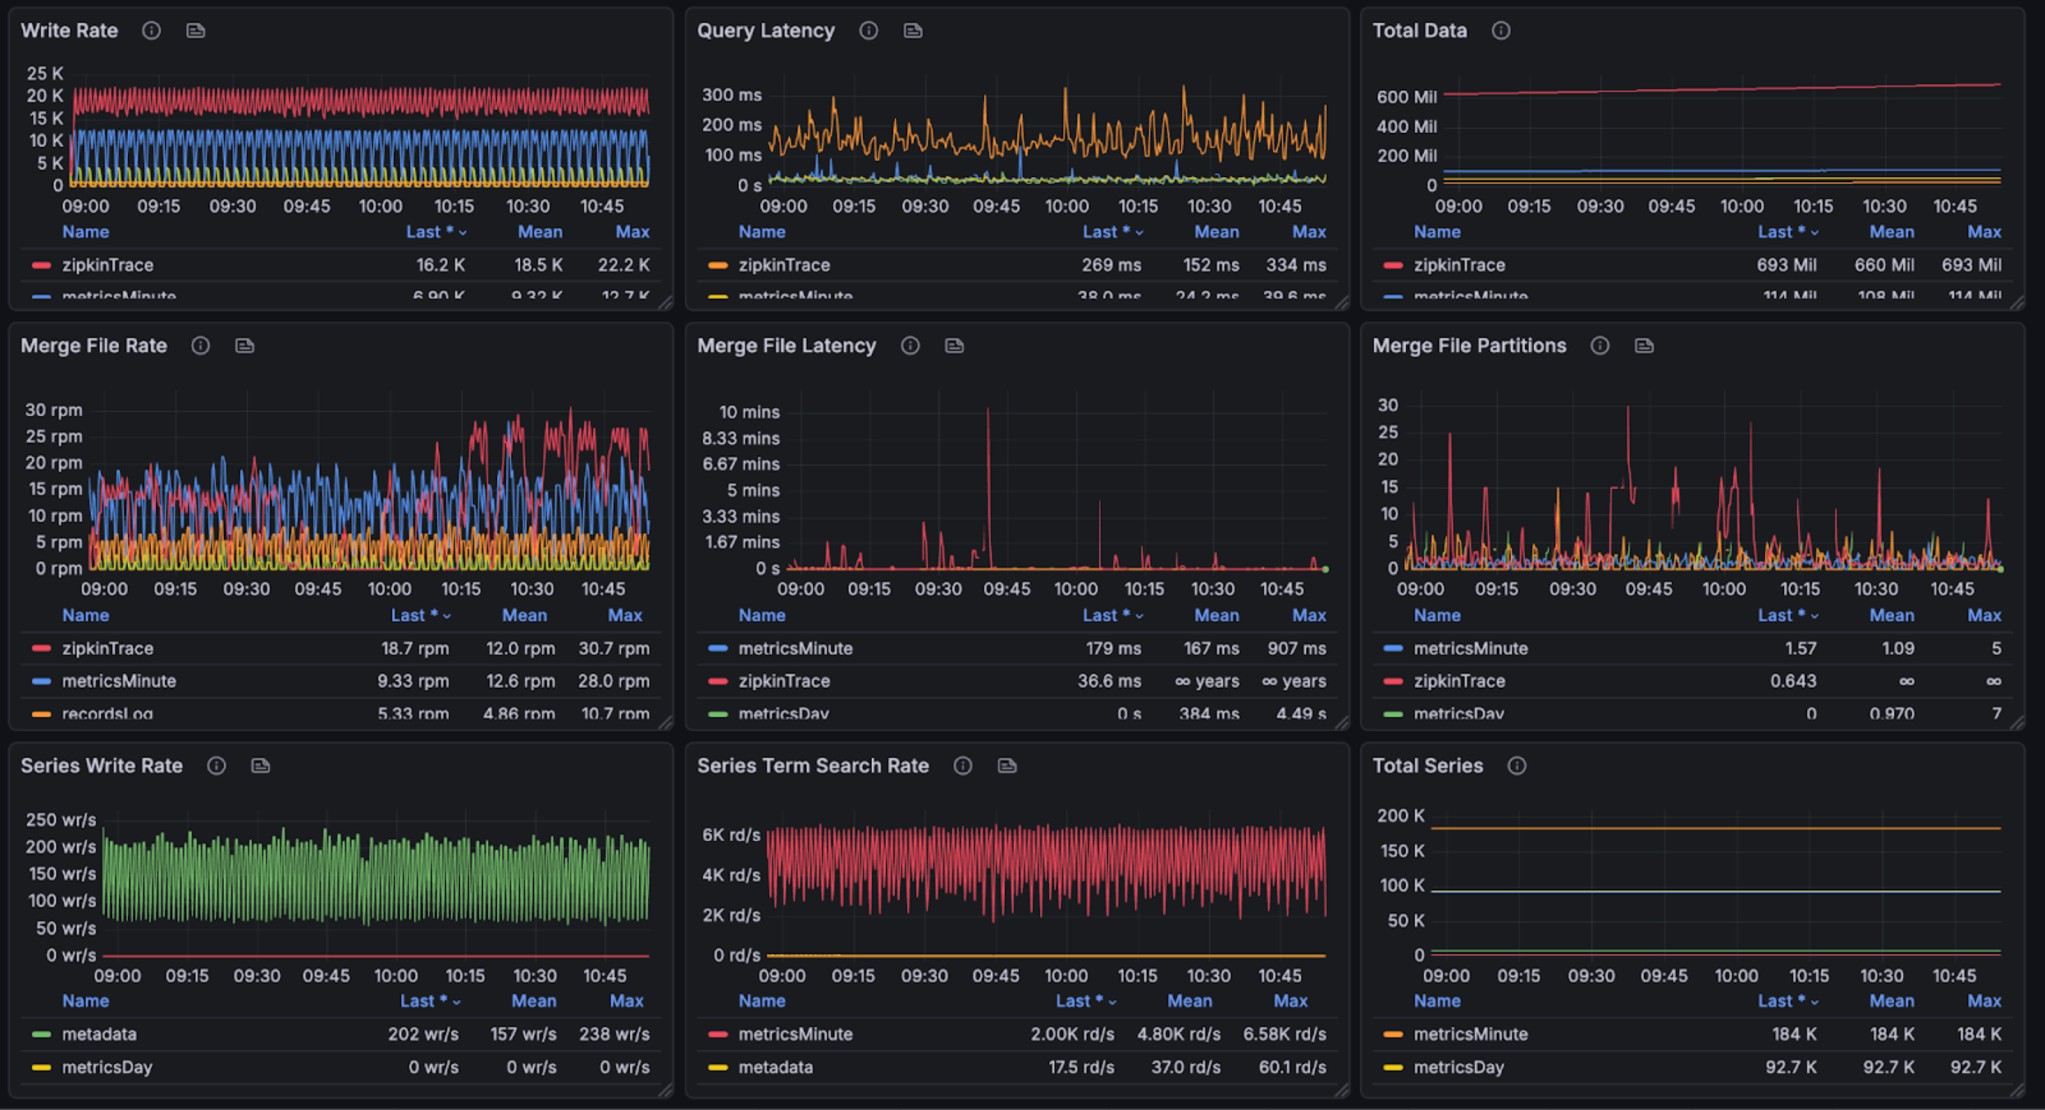
Write
The test involves 426 services, 2,820 instances, and 4,500 endpoints. These entities produce over 21,600 logs per minute, write 599,400 spans per minute(max 8,000 spans per second). Note, ~23x more spans compared with small specification test. 31.44g disk volume in 2 hours for all telemetry data, 31.2g disk volume in 2 hours for trace. It should takes over ~3pb dist volume in 7 days for all telemtry, and 2.8pb for trace,
The following graphs illustrate the resource usage during write operations, showing CPU and memory consumption across the BanyanDB cluster:
Read
During query and writing, 250% CPU(few peak in 350%), 20% avg, 25% peak memory cost(total 8g). Note, other parts are used by OS Page Cache. We don’t have measurement to check the efficiency of that.
The query performance metrics per request are as follows:
- Log Query Performance: min,max,mean,median,p90,p95,p98,p99 duration(millisecond): 2.302522, 208.608713, 33.616845, 22.217282, 74.080696, 105.510697, 128.287975, 167.144936
- Trace Query Performance: min,max,mean,median,p90,p95,p98,p99 duration(millisecond): 51.433364, 356.743882, 142.805840, 129.244039, 234.051115, 245.536086, 271.894946, 301.822043
- Metrics query in major dashboards are good.
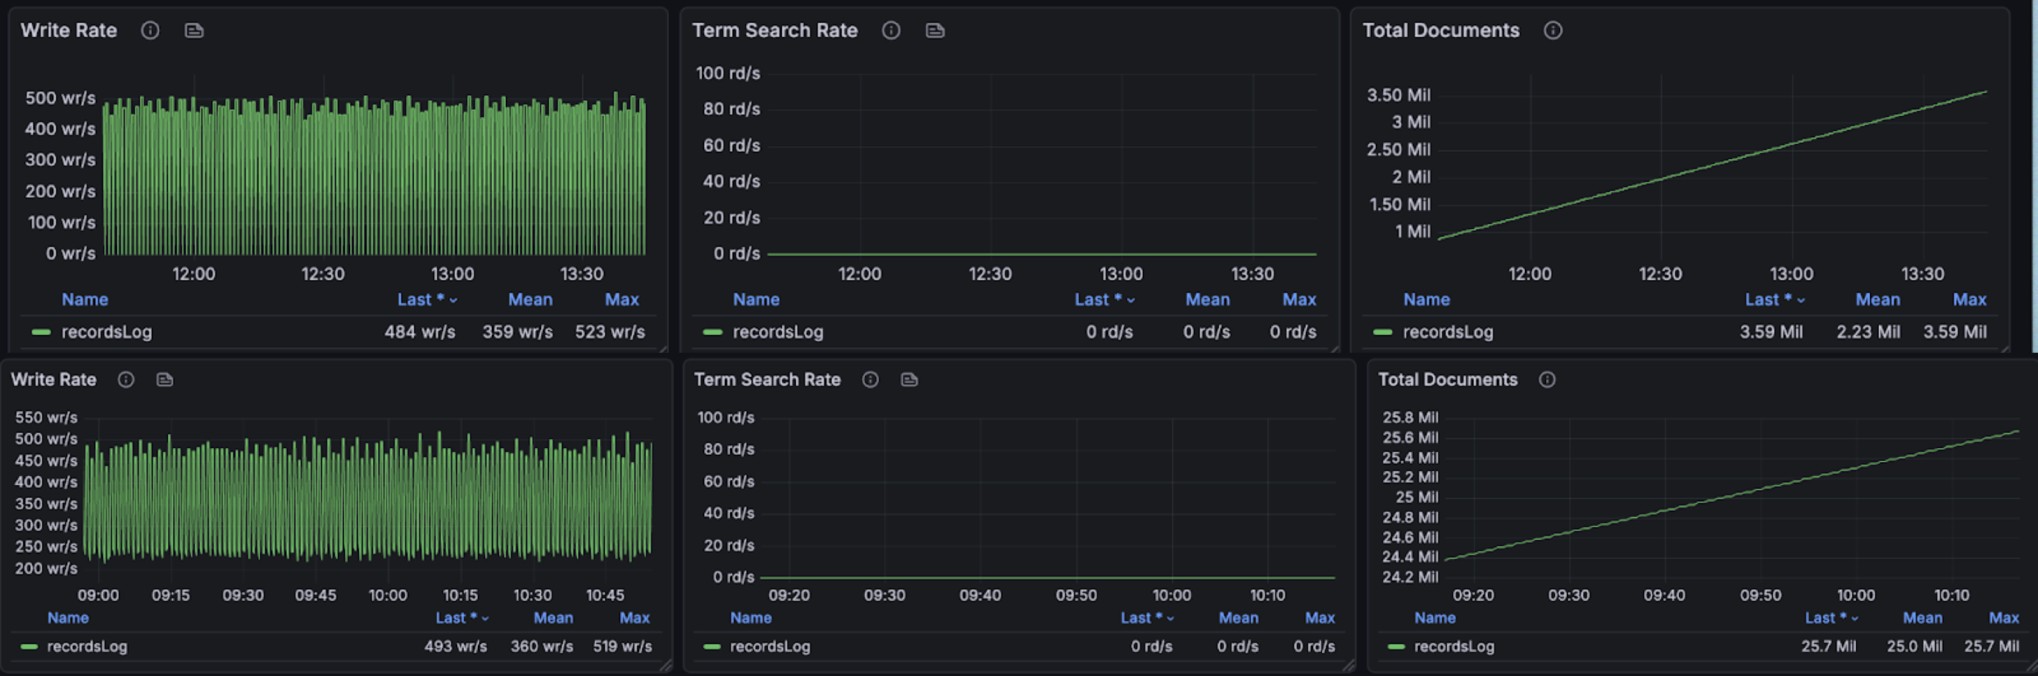
The graphs below show resource utilization during combined read and write operations, demonstrating BanyanDB’s ability to handle concurrent workloads:
Summary
This benchmark demonstrates BanyanDB’s capability to efficiently handle high-throughput observability workloads in mixed write and read scenarios.
On a low-spec 2U4G configuration, it supports 426 services, 2,820 instances, and 4,500 endpoints, processing 21,600 logs per minute and writing 26,640 spans per minute (max 4,000 spans per second). It maintains low disk utilization even under concurrent read/write loads, with query performance remaining responsive.
At the higher 4U8G specification, it can still support 426 services, 2,820 instances, and 4,500 endpoints, process 21,600 logs per minute, and write 599,400 spans per minute (max 8,000 spans per second). During massive trace writes, it maintains low system utilization and minimal disk usage. Query performance also outperforms lower-spec configurations.
The above comparisons across low- and high-spec configurations demonstrate that BanyanDB maintains low resource consumption during writes as specifications increase, while delivering higher throughput when resources are scaled up.