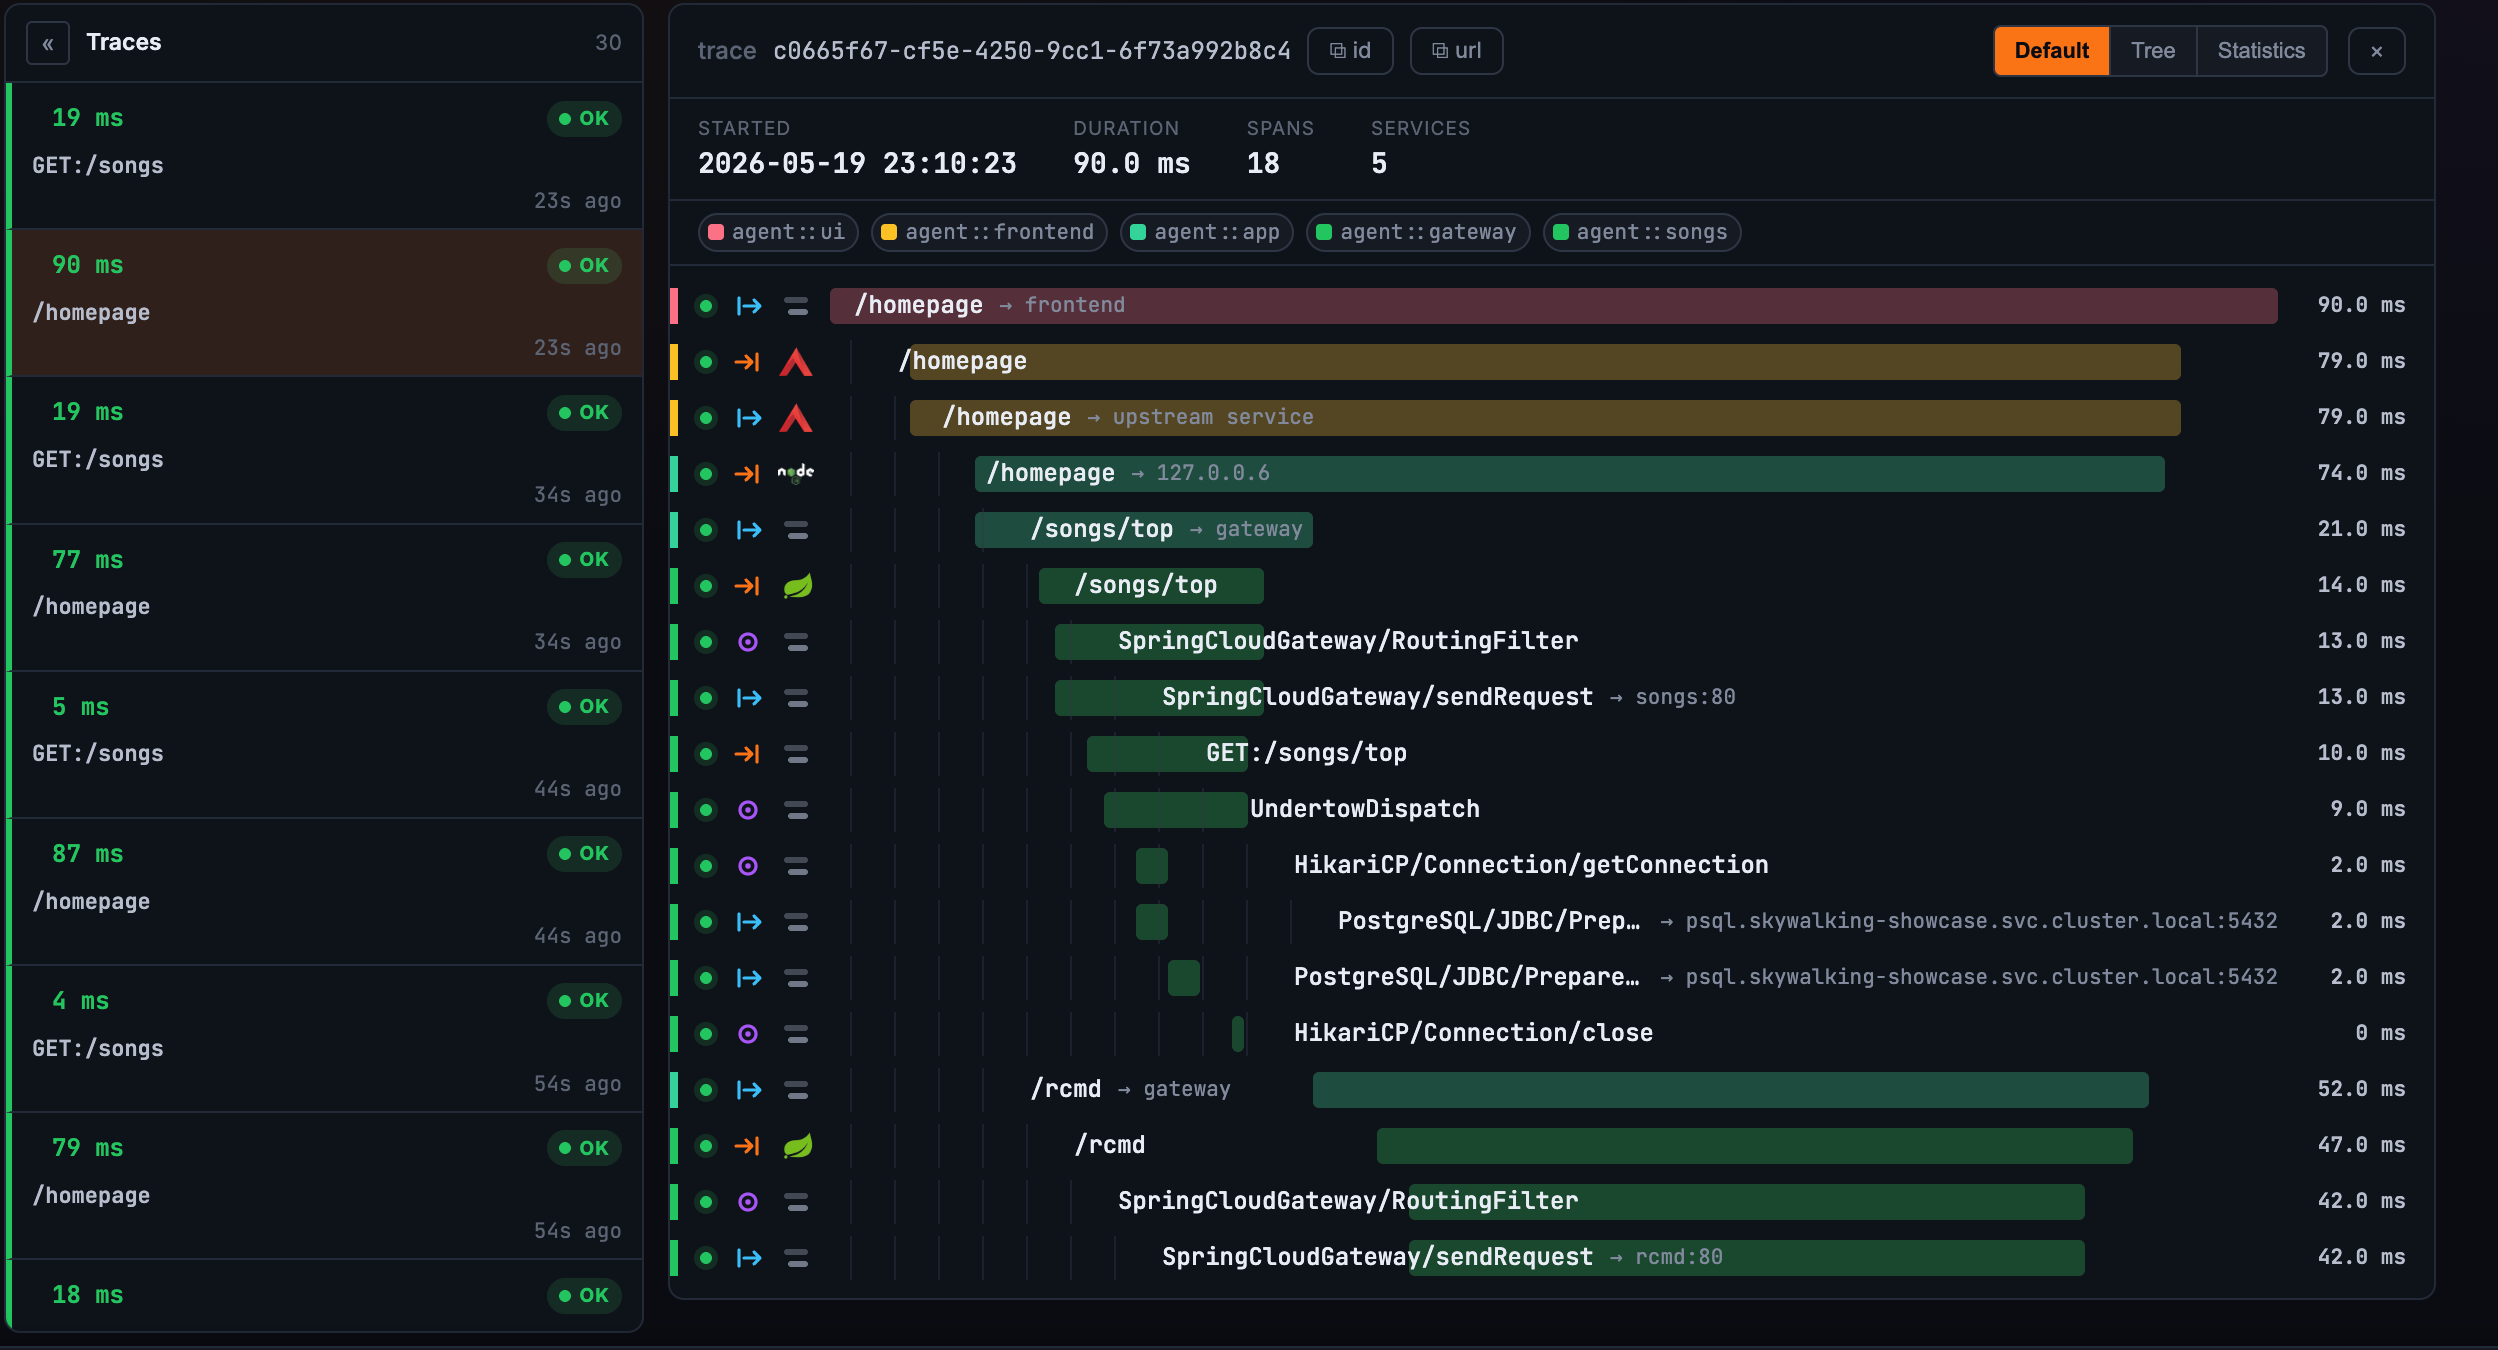
End-to-end distributed tracing
Native plus Zipkin v1/v2 formats. Auto-instrument 10+ languages, eBPF on Kubernetes, and dependency analysis across services and APIs.
Learn more →
Apache SkyWalking puts distributed tracing, metrics, logs, profiling and alarms in one platform — across the services you run and the GenAI models they call, down to tokens and cost. 10+ language agents, eBPF on Kubernetes, and a built-in assistant you can ask in natural language.
No frontier model required. Vendor-neutral — any OpenAI-compatible endpoint or Amazon Bedrock — and runs efficiently on a cost-effective model like DeepSeek or a mid-tier Claude Sonnet. The observability know-how lives in the tools, metric catalog and playbooks; the model orchestrates and narrates. Off by default.
Horizon's built-in assistant answers questions about your running system — "what's unhealthy right now?", "investigate latency for checkout" — with no MQE, PromQL or TraceQL to write. It replies with an ordered narrative built from the same charts, topology and tables as the rest of the UI, not a wall of text.
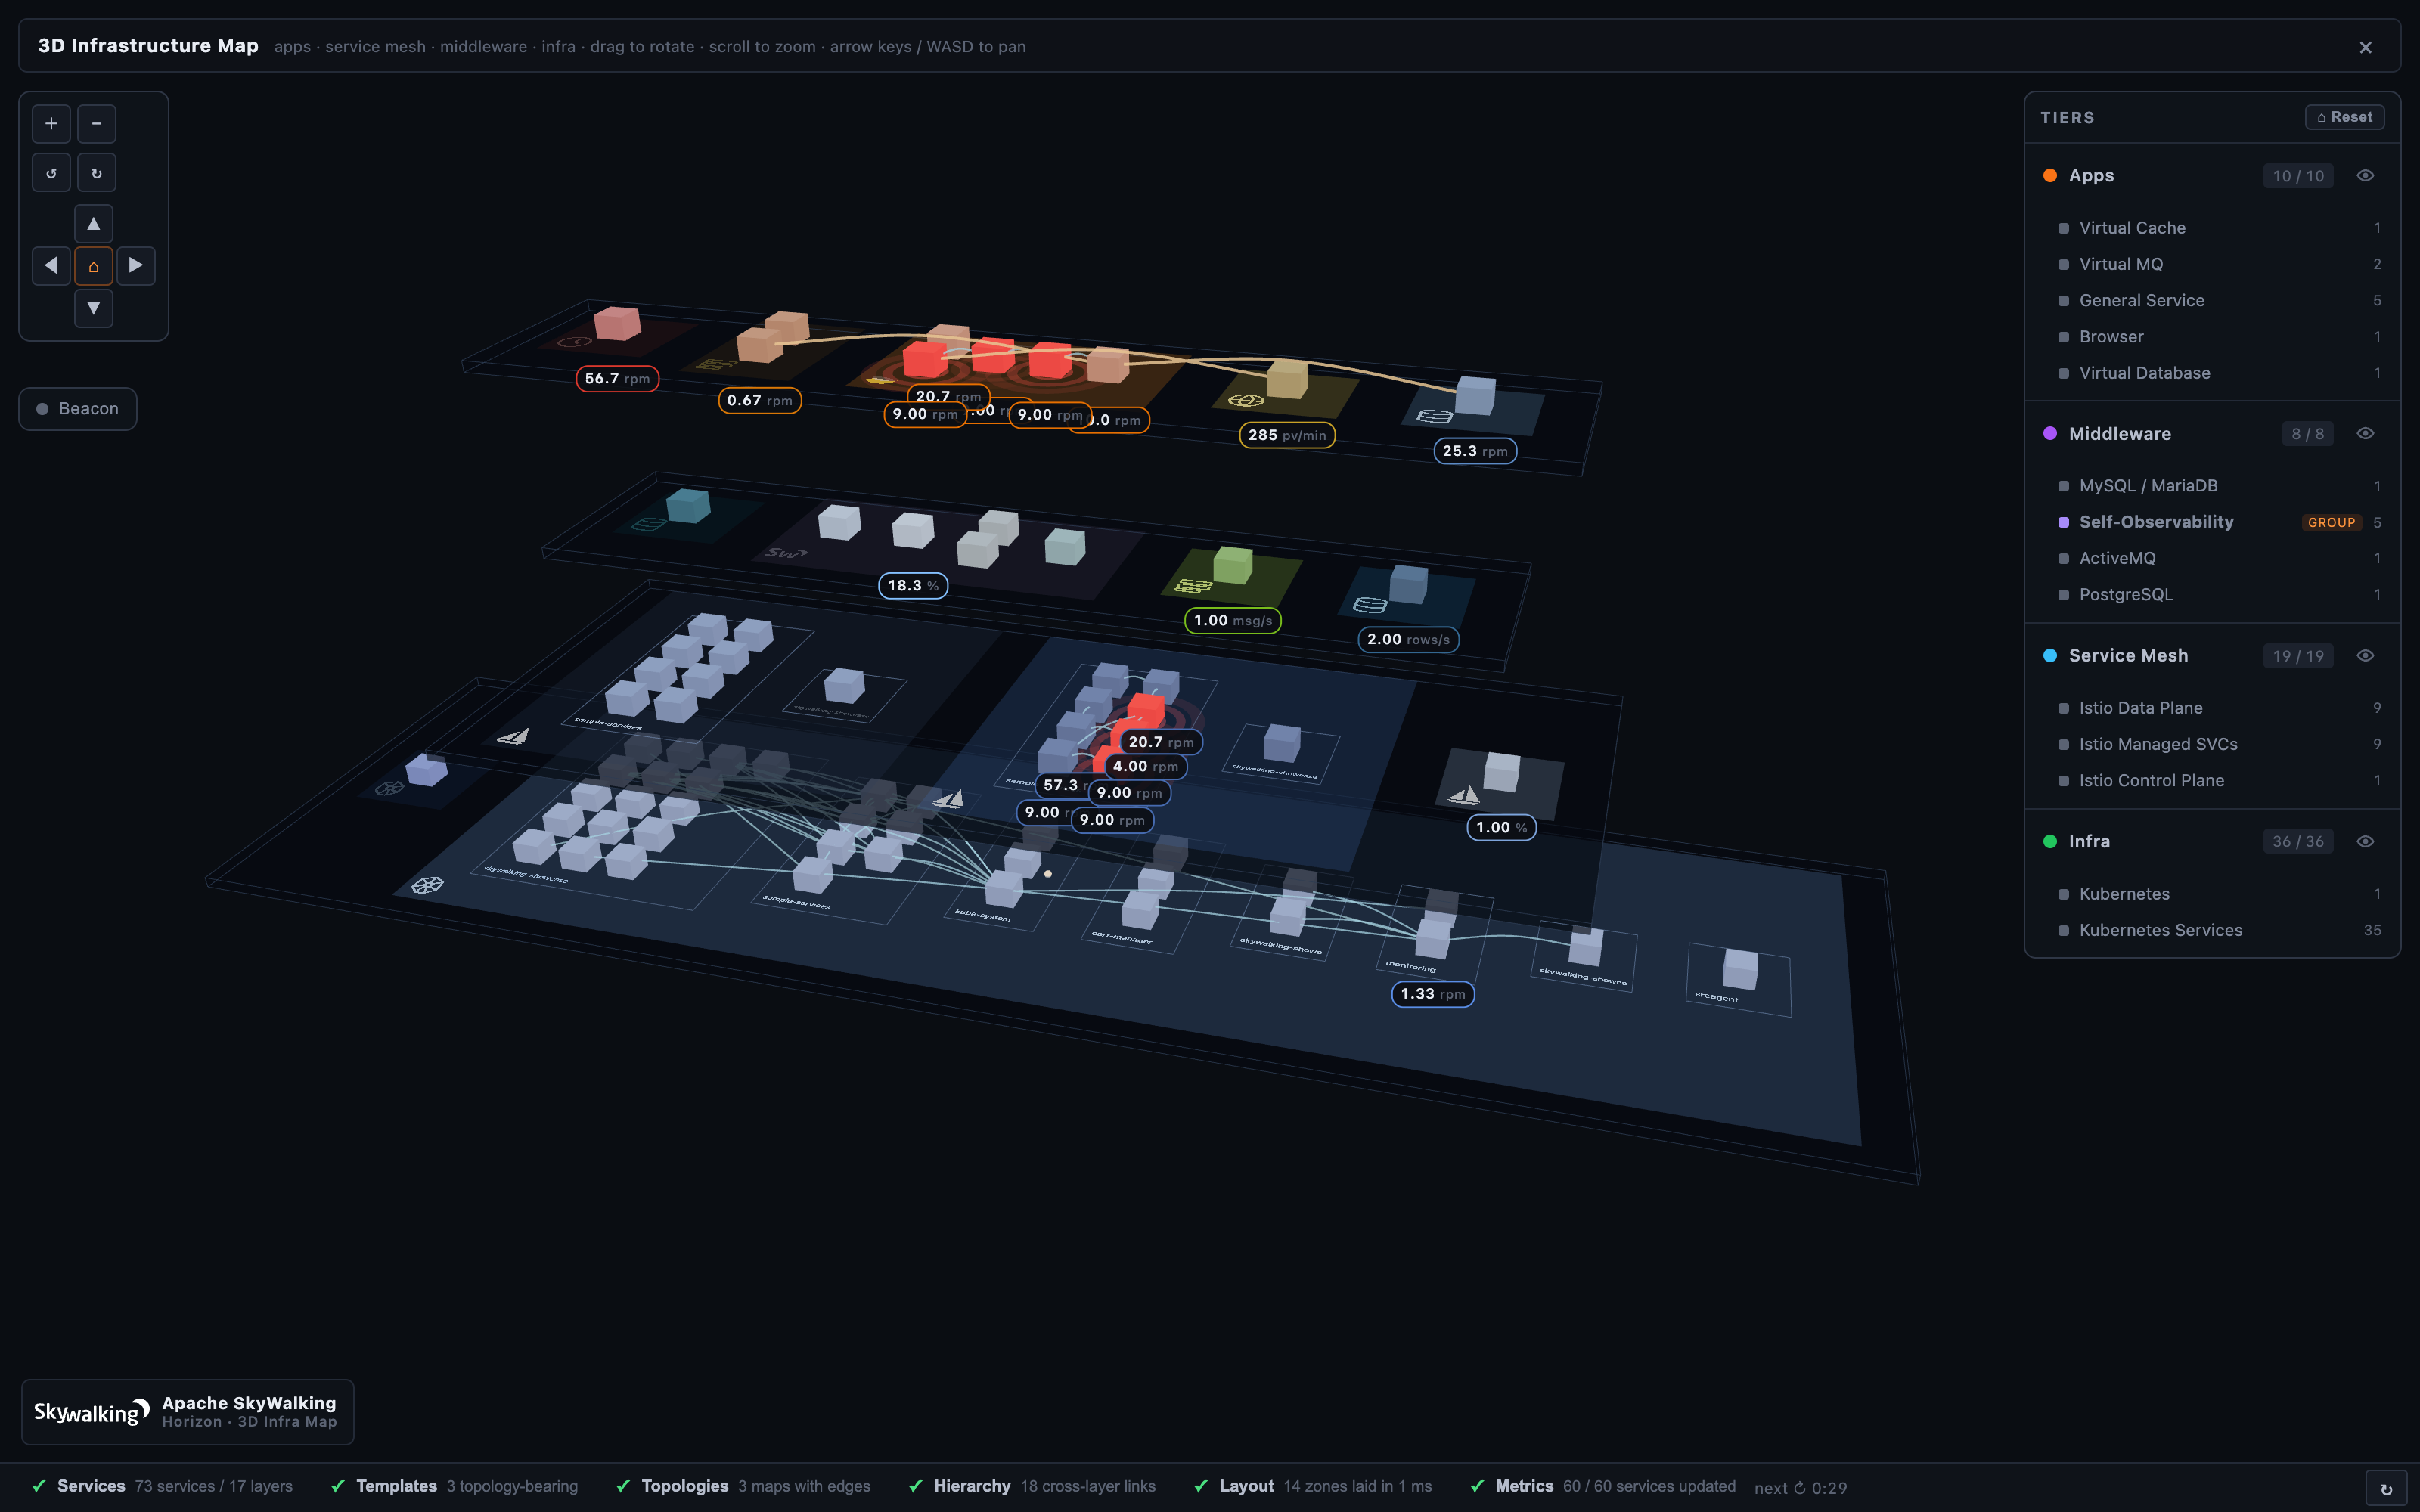
Walk your services and cloud-native infrastructure as a living 3D scene — orbit, zoom and click any node to inspect it. It opens as a full page and runs entirely in your browser from a frozen demo snapshot: no server, no login, no setup.
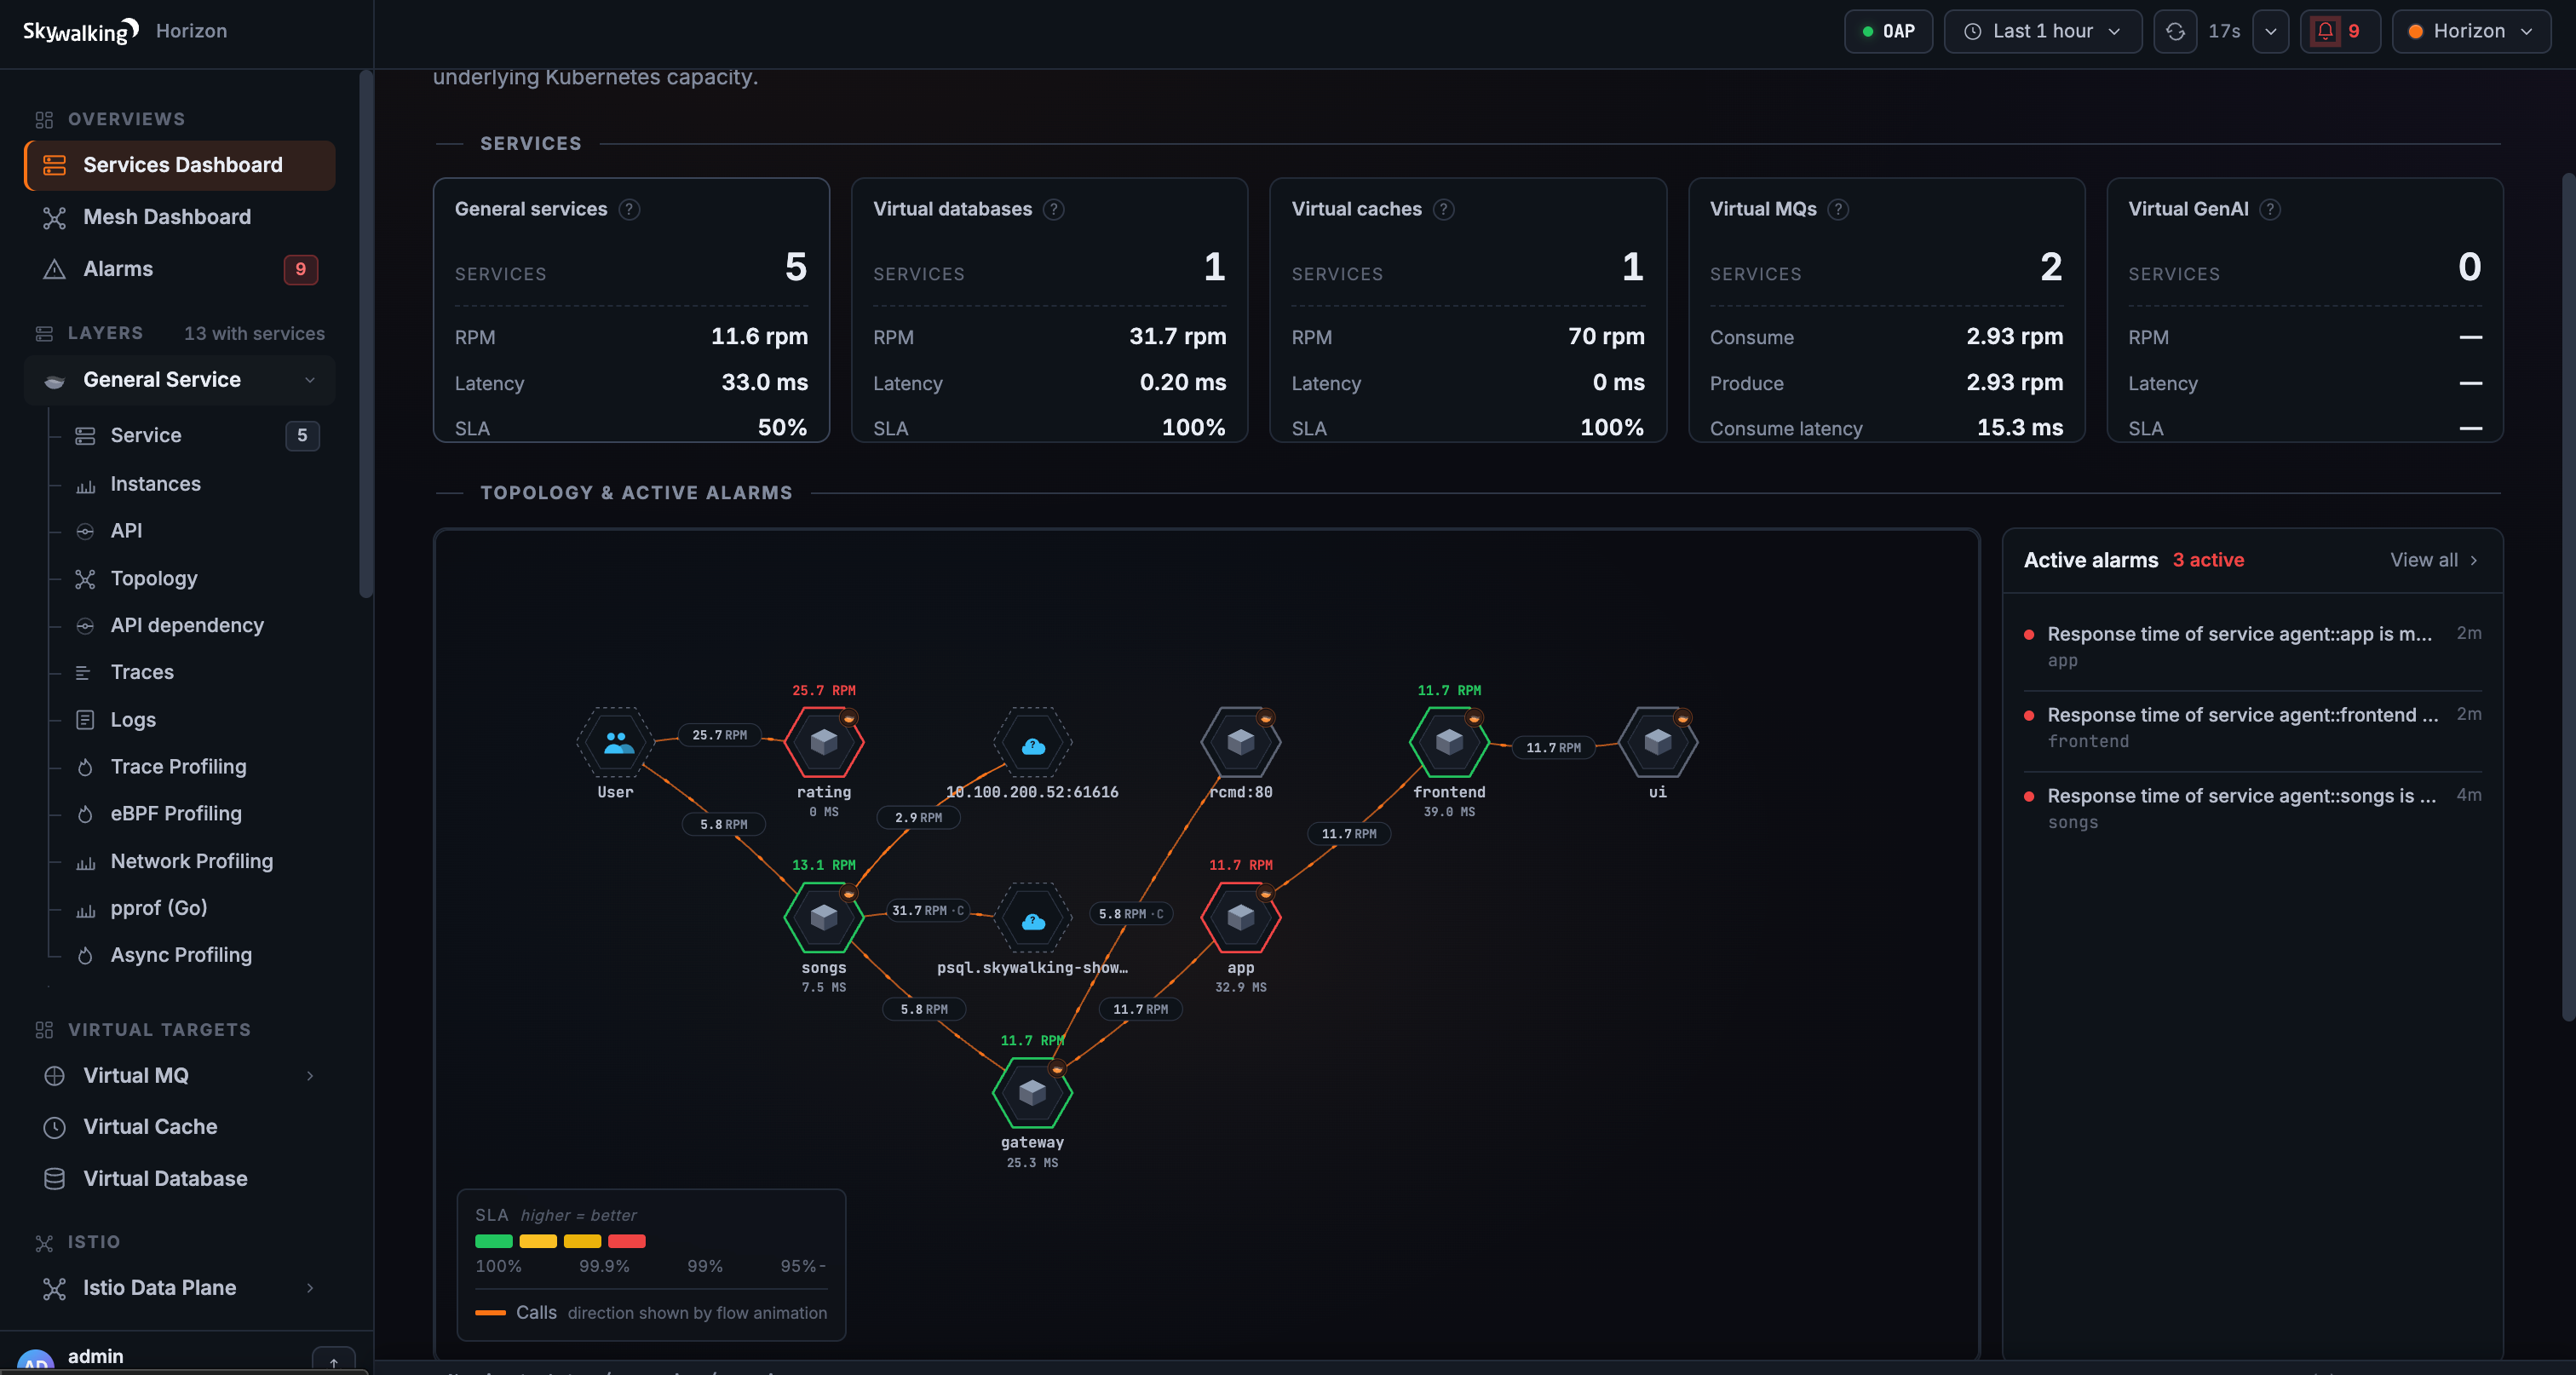
An observability platform designed for cloud-native systems. Auto-instrument the languages you run, observe the kernel via eBPF, and store the volume natively in BanyanDB.
Native plus Zipkin v1/v2 formats. Auto-instrument 10+ languages, eBPF on Kubernetes, and dependency analysis across services and APIs.
Learn more →OTLP, native, OpenCensus, Telegraf and Zabbix flow through one MAL script pipeline — 100B+ data points per cluster.
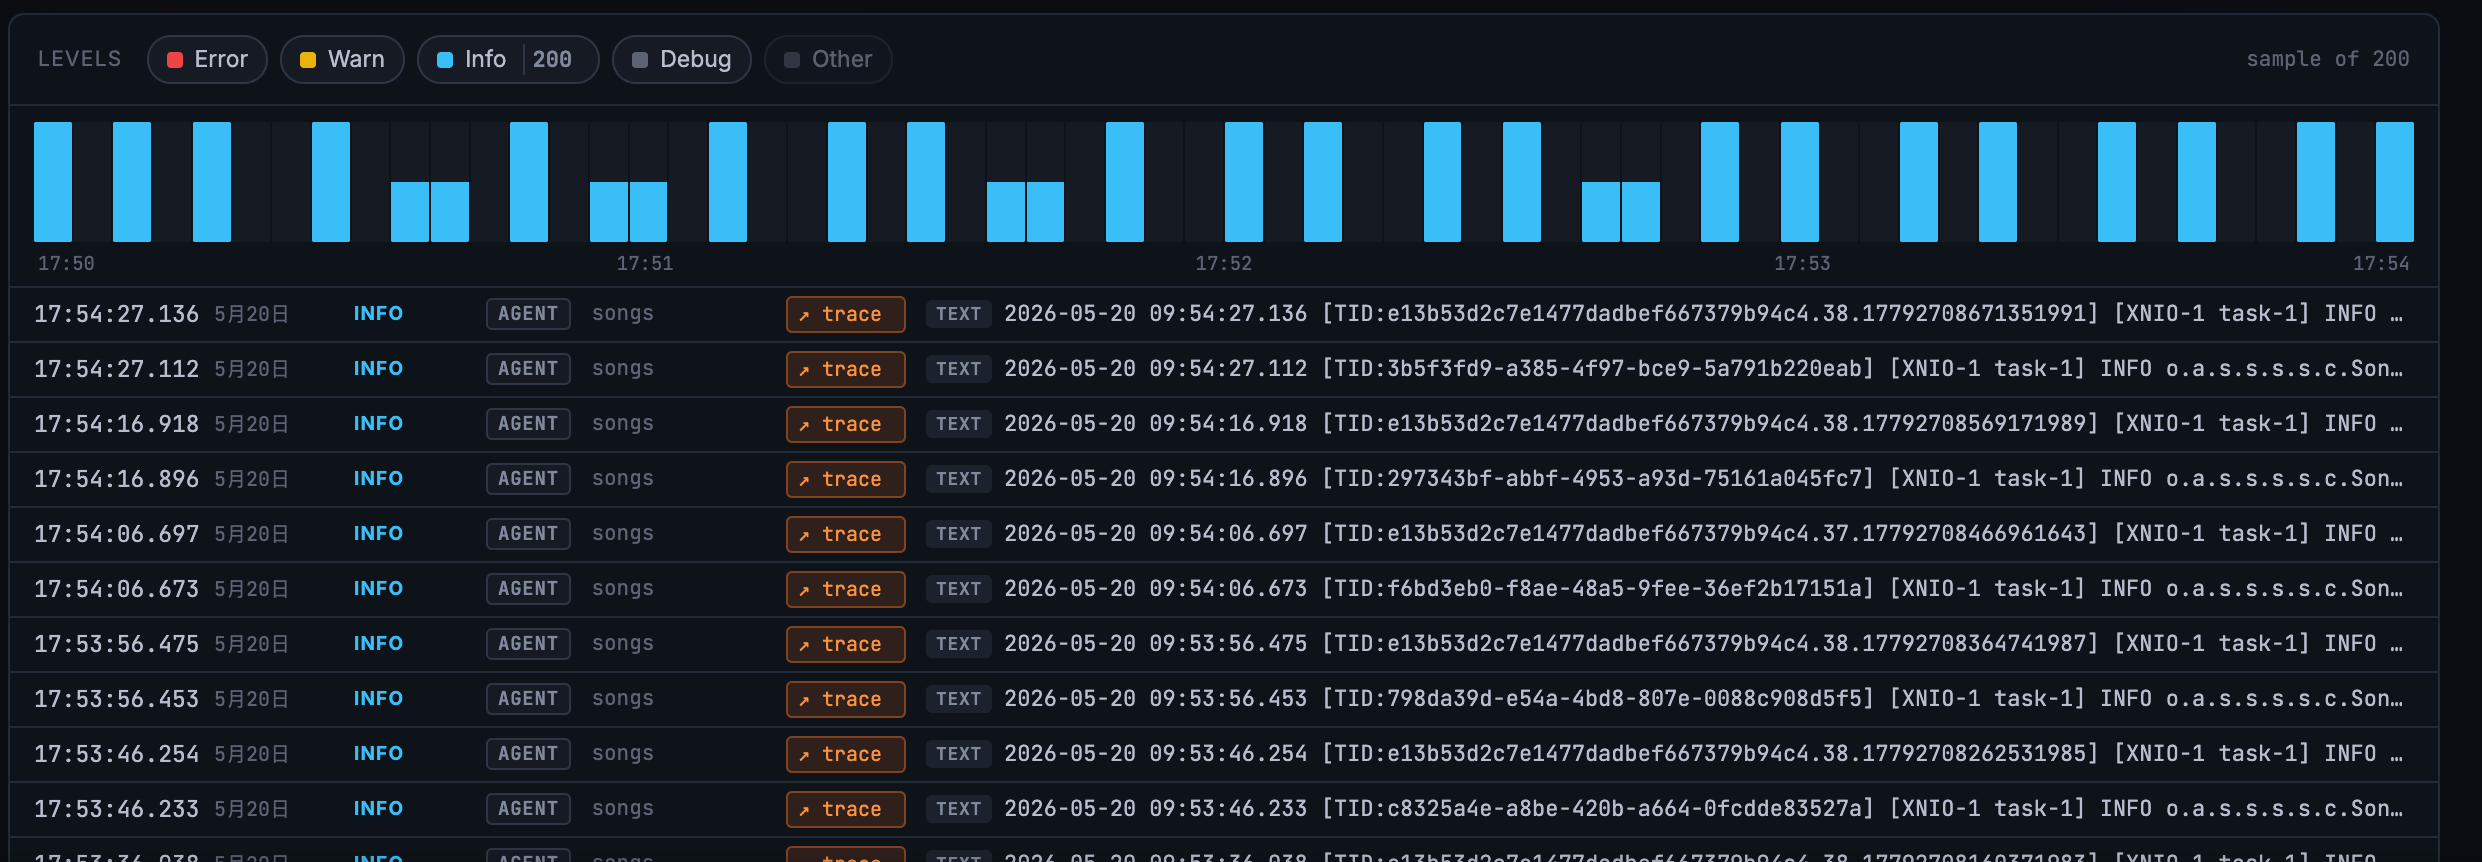
Learn more →Collect from disk or network, auto-bind trace context, extract metrics, sample by policy, and forward anywhere.
Learn more →CPU and async profiling bundled in language agents. eBPF profiler on Rover for Kubernetes deployments.
Learn more →Latency, traffic, success rate, input/output tokens and estimated cost, per provider and model — from SkyWalking, OTLP or Zipkin traces.
Learn more →Every server, agent, database and integration in the project — each with documentation for every released version.
Browse documentation →Language agents, service mesh, eBPF, a native observability database, and broad telemetry-format support — vendor-neutral and Apache-governed.
Java, Go, Python, Node.js, PHP, Rust, Ruby, .NET, LUA, C++ and Client JavaScript — actively maintained.
11 language agents →Monitor and profile Kubernetes deployments and diagnose CPU and network performance with eBPF.
Rover docs →A native observability database built to ingest, analyze and store telemetry at scale.
BanyanDB docs →Ask Horizon UI to investigate in natural language — LLM-driven root cause, read-only and grounded in live data — plus ML baselines and anomaly detection.
AI on the blog →SkyWalking NodeJS 0.9.0 is released. Go to downloads page to find release tars. What’s Changed …
SkyWalking Horizon UI 0.7.0 is released. Go to downloads page to find release tars. This release …
SkyWalking BanyanDB 0.10.3 is released. Go to downloads page to find release tars. Bug Fixes Persist …
The Meet Horizon UI series wrapped at 17/17 — a full tour of every surface of SkyWalking’s new …
This is the thirteenth post in the Meet Horizon UI series, and the last stop in Act 3 — operate it. …
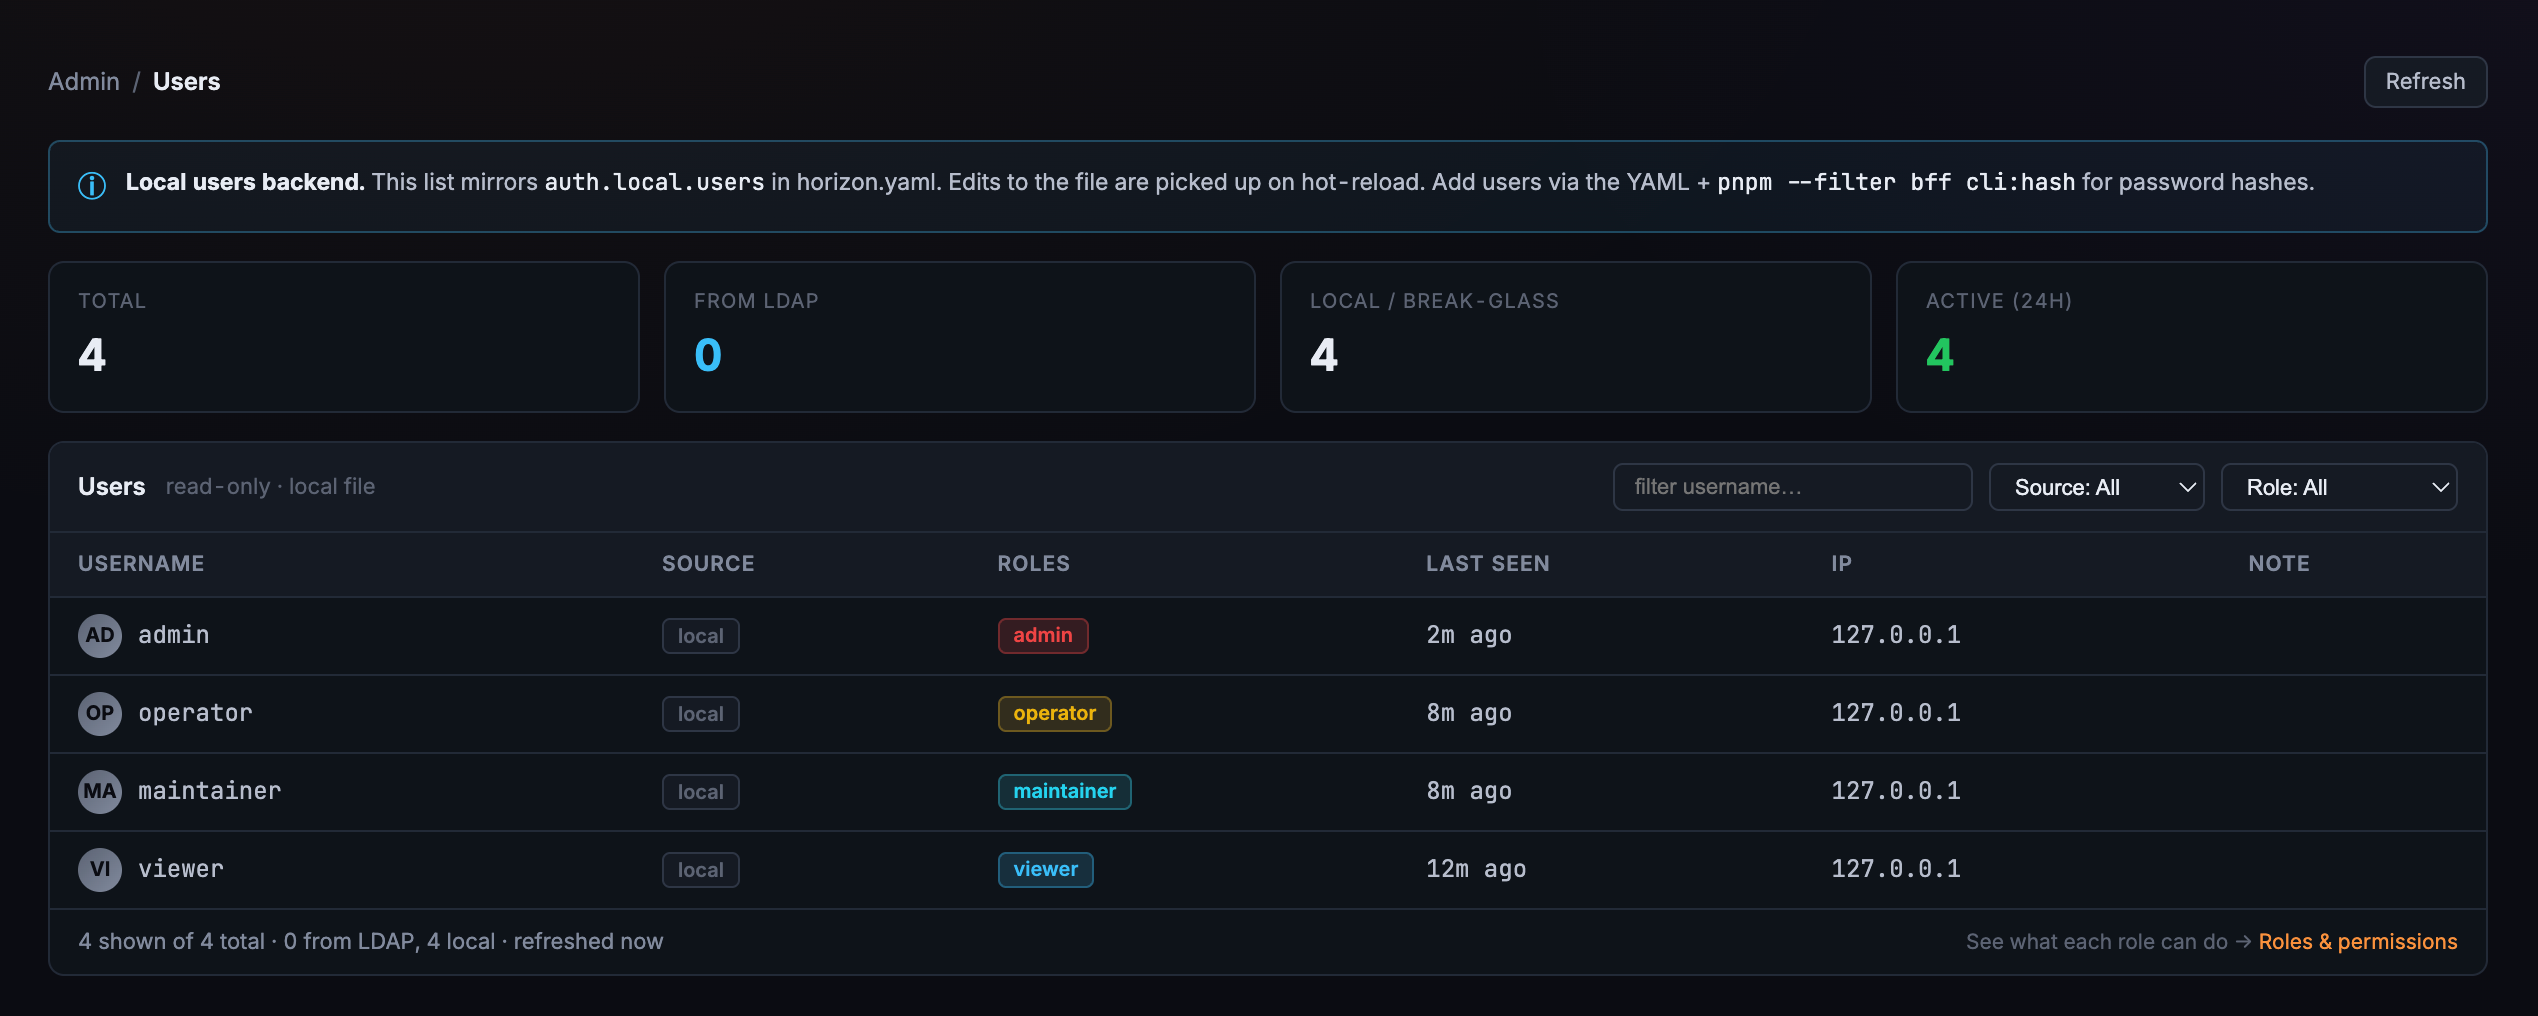
This is the fourteenth post in the Meet Horizon UI series, and it opens Act 4 — govern & secure …
Spin up the Showcase to see Apache SkyWalking in action, or install the platform — then join a community built by 1014 contributors.
Open a discussion or file an issue on GitHub — feature requests, questions and bug reports all welcome.
GitHub Discussions →Chat with maintainers and users in real time. ASF self-signup only works for @apache.org addresses, so ask the dev mailing list and a maintainer will invite you.
dev@skywalking.apache.org →Announcements, releases and the latest features — follow @ASFSkyWalking for project news.
@ASFSkyWalking →