Observability
This document outlines the observability features of BanyanDB, which include metrics, profiling, and tracing. These features help monitor and understand the performance, behavior, and overall health of BanyanDB.
Logging
BanyanDB uses the zerolog library for logging. The log level can be set using the log-level flag. The supported log levels are debug, info, warn, error, and fatal. The default log level is info.
logging-env is used to set the logging environment. The default value is prod. The logging environment can be set to dev for development or prod for production. The logging environment affects the log format and output. In the dev environment, logs are output in a human-readable format, while in the prod environment, logs are output in JSON format.
logging-modules and logging-levels are used to set the log level for specific modules. The logging-modules flag is a comma-separated list of module names, and the logging-levels flag is a comma-separated list of log levels corresponding to the module names. The log level for a specific module can be set using these flags. Available modules are storage, distributed-query, liaison-grpc, liaison-http, measure, stream, trace, metadata, schema-registry, metrics, pprof-service, query, server-queue-sub, server-queue-pub. For example, to set the log level for the storage module to debug, you can use the following flags:
--logging-modules=storage --logging-levels=debug
Slow Query Logging
BanyanDB supports slow query logging. The slow-query flag is used to set the slow query threshold. If a query takes longer than the threshold, it will be logged as a slow query. The default value is 0, which means no slow query logging. This flag is only used for the data and standalone servers.
The dst-slow-query flag is used to set the distributed slow query threshold. This flag is only used for the liaison server. The default value is 0, which means no distributed slow query logging.
When query tracing is enabled, the slow query log won’t be generated.
Metrics
BanyanDB expose metrics for monitoring and analysis. In this part, we use some variables to represent the metrics, such as $job and $instance. The $job is the job name of the BanyanDB collection job, and the $instance is the instance name of the BanyanDB instance.
__rate_interval is a variable that represents the rate interval. It is used to calculate the rate of metrics.
Stats
Stats metrics are used to monitor the overall status of BanyanDB. The following metrics are available:
Write Rate
The write rate is the number of write operations per second. It is calculated by summing the total number of written operations for measures, streams and traces.
Expression: sum(rate(banyandb_measure_total_written{job=~\"$job\", instance=~\"$instance\"}[$__rate_interval])) + sum(rate(banyandb_stream_tst_total_written{job=~\"$job\", instance=~\"$instance\"}[$__rate_interval])) + sum(rate(banyandb_trace_tst_total_written{job=~\"$job\", instance=~\"$instance\"}[$__rate_interval]))
Total Memory
The total memory is the total physical memory available on the system, which means total amount of RAM on the system.
Expression: sum(banyandb_system_memory_state{job=~\"$job\", instance=~\"$instance\",kind=\"total\"})
Disk Usage
The disk usage is the percentage of disk space used. If the disk usage is over 80%, it may indicate that the disk is almost full.
Expression: sum(banyandb_system_disk{job=~\"$job\", instance=~\"$instance\",kind=\"used\"})
Query Rate
The query rate is the number of query operations per second. It is the query rate on the liaison server.
Expression: sum(rate(banyandb_liaison_grpc_total_started{job=~\"$job\", instance=~\"$instance\", method=\"query\"}[$__rate_interval]))
Total CPU
The total CPU is the total number of CPUs available on the system.
Expression: sum(banyandb_system_cpu_num{job=~\"$job\", instance=~\"$instance\"})
Write and Query Errors Rate
The write and query errors rate is the number of write and query errors per minute. It is calculated by summing the total number of write and query errors from liaison and data servers.
Expression: sum(rate(banyandb_liaison_grpc_total_err{job=~\"$job\",instance=~\"$instance\",method=\"query\"}[$__rate_interval])*60) + sum(rate(banyandb_liaison_grpc_total_stream_msg_sent_err{job=~\"$job\",instance=~\"$instance\"}[$__rate_interval])*60) + sum(rate(banyandb_liaison_grpc_total_stream_msg_received_err{job=~\"$job\",instance=~\"$instance\"}[$__rate_interval])*60) + sum(rate(banyandb_queue_sub_total_msg_sent_err{job=~\"$job\",instance=~\"$instance\"}[$__rate_interval])*60)
Registry Operation Rate
The registry operation rate is the number of registry operations per second. It is calculated by summing the total number of registry operations.
Expression: sum(rate(banyandb_liaison_grpc_total_registry_started{job=~\"$job\",instance=~\"$instance\"}[$__rate_interval])) + sum(rate(banyandb_liaison_grpc_total_started{job=~\"$job\",instance=~\"$instance\",method!=\"query\"}[$__rate_interval]))
Active Instances
The active instances is the number of active instances in the BanyanDB cluster.
Expression: sum(min_over_time(up{job=~\"$job\", instance=~\"$instance\"}[$__rate_interval])) by (job)
Resource Usage
Resource Usage metrics are used to monitor the resource usage of BanyanDB on the node. The following metrics are available:
CPU Usage
The CPU usage is the percentage of CPU used. If the CPU usage is over 80%, it may indicate that the CPU is overloaded.
Expression: max(rate(process_cpu_seconds_total{job=~\"$job\", instance=~\"$instance\"}[$__rate_interval]) / banyandb_system_cpu_num{job=~\"$job\", instance=~\"$instance\"}) by (job)
RSS memory usage
The RSS memory usage is the percentage of resident memory used. If the memory usage is over 80%, it may indicate that the memory is almost full.
Expression: max(max_over_time(process_resident_memory_bytes{job=~\"$job\", instance=~\"$instance\"}[$__rate_interval]) / sum(banyandb_system_memory_state{job=~\"$job\", instance=~\"$instance\", kind=\"total\"}) by (job,instance)) by(job)
Disk Usage
The disk usage is the percentage of disk space used. If the disk usage is over 80%, it may indicate that the disk is almost full.
Expression: max(sum(banyandb_system_disk{job=~\"$job\", instance=~\"$instance\", kind=\"used\"}) / sum(banyandb_system_memory_state{job=~\"$job\", instance=~\"$instance\", kind=\"total\"})) by (job)
Network Usage
The network usage is the number of bytes sent and received per second.
Expression1: sum(rate(banyandb_system_net_state{job=~\"$job\",instanct=~\"$instance\",kind=\"bytes_recv\"}[$__rate_interval])) by (name)
Expression2: sum(rate(banyandb_system_net_state{job=~\"$job\",instanct=~\"$instance\",kind=\"bytes_sent\"}[$__rate_interval])) by (name)
Storage
Storage metrics are used to monitor the storage status of BanyanDB. The following metrics are available:
Write Rate
The write rate is the number of write operations per second. It is calculated by summing the total number of written operations for measures, streams and traces. It’s grouped by the group tag.
You can view the write rate of different instance to find out the hot instance.
Expression: sum(rate(banyandb_measure_total_written{job=~\"$job\", instance=~\"$instance\"}[$__rate_interval])) by (group) + sum(rate(banyandb_stream_tst_total_written{job=~\"$job\", instance=~\"$instance\"}[$__rate_interval])) by (group) + sum(rate(banyandb_trace_tst_total_written{job=~\"$job\", instance=~\"$instance\"}[$__rate_interval])) by (group)
Query Latency
The query latency is the average query latency in seconds. It is calculated by summing the total query latency and dividing by the total number of queries.
You can view the query latency of different instance to find out the instance with high query latency. Because BanyanDB will fetch all instances to query, the query latency of the instance with high query latency will affect the overall query latency.
Expression: sum(rate(banyandb_liaison_grpc_total_latency{job=~\"$job\", instance=~\"$instance\",method=\"query\"}[$__rate_interval])) by( group) / sum(rate(banyandb_liaison_grpc_total_started{job=~\"$job\", instance=~\"$instance\",method=\"query\"}[$__rate_interval])) by (group)
Total Data
The total data is the total number of data points stored in BanyanDB. It’s grouped by the group tag.
You can view the total data of different instance to find out the instance with high data points. If the difference between the total data of different instances is too large, it may indicate that the data is not evenly distributed.
Expression1: sum(banyandb_measure_total_file_elements{job=~\"$job\",instance=~\"$instance\"})by(group)
Expression2: sum(banyandb_stream_tst_total_file_elements{job=~\"$job\",instance=~\"$instance\"})by(group)
Expression3: sum(banyandb_trace_tst_total_file_elements{job=~"$job",instance=~"$instance"})by(group)
Merge File Rate
The merge file rate is the number of merge file operations per minute. It is calculated by summing the total number of merge file operations. It’s grouped by the group tag.
If the value surges, it may indicate that too many small files are being merged. It may bring following problems:
- Increase the disk I/O
- Slow down the query performance
- Increase the CPU usage
Expression1: sum(rate(banyandb_measure_total_merge_loop_started{job=~\"$job\",instance=~\"$instance\"}[$__rate_interval]))by(group) * 60
Expression2: sum(rate(banyandb_stream_tst_total_merge_loop_started{job=~\"$job\",instance=~\"$instance\"}[$__rate_interval]))by(group) * 60
Expression3: sum(rate(banyandb_trace_tst_total_merge_loop_started{job=~"$job",instance=~"$instance"}[$__rate_interval]))by(group) * 60
Merge File Latency
The merge file latency is the average merge file latency in seconds. It is calculated by summing the total merge file latency and dividing by the total number of merge file operations. It’s grouped by the group tag.
If the value surges, it may indicate that the merge file operation is slow. It may be caused by the high disk I/O and other resource usage. It may bring following problems:
- Slow down the query performance
- Increase the CPU usage
- Increase the memory usage
Expression1: sum(rate(banyandb_measure_total_merge_latency{job=~\"$job\", instance=~\"$instance\",type=\"file\"}[$__rate_interval]))by(group) / sum(rate(banyandb_measure_total_merge_loop_started{job=~\"$job\",instance=~\"$instance\"}[$__rate_interval]))by(group)
Expression2: sum(rate(banyandb_stream_tst_total_merge_latency{job=~\"$job\", instance=~\"$instance\",type=\"file\"}[$__rate_interval]))by(group) / sum(rate(banyandb_stream_tst_total_merge_loop_started{job=~\"$job\",instance=~\"$instance\"}[$__rate_interval]))by(group)
Expression3: sum(rate(banyandb_trace_tst_total_merge_latency{job=~"$job", instance=~"$instance",type="file"}[$__rate_interval]))by(group) / sum(rate(banyandb_trace_tst_total_merge_loop_started{job=~"$job",instance=~"$instance"}[$__rate_interval]))by(group)
Merge File Partitions
The merge file partitions is the average number of partitions merged per merge file operation. It is calculated by summing the total number of partitions merged and dividing by the total number of merge file operations. It’s grouped by the group tag.
If the value surges, it may indicate that too many partitions are being merged. It may because the partition number is too large that indicates the server is under a high write load.
Expression1: sum(rate(banyandb_measure_total_merged_parts{job=~\"$job\", instance=~\"$instance\",type=\"file\"}[$__rate_interval]))by(group) / sum(rate(banyandb_measure_total_merge_loop_started{job=~\"$job\",instance=~\"$instance\"}[$__rate_interval]))by(group)
Expression2: sum(rate(banyandb_stream_tst_total_merged_parts{job=~\"$job\", instance=~\"$instance\",type=\"file\"}[$__rate_interval]))by(group) / sum(rate(banyandb_stream_tst_total_merge_loop_started{job=~\"$job\",instance=~\"$instance\"}[$__rate_interval]))by(group)
Expression3: sum(rate(banyandb_trace_tst_total_merged_parts{job=~"$job", instance=~"$instance",type="file"}[$__rate_interval]))by(group) / sum(rate(banyandb_trace_tst_total_merge_loop_started{job=~"$job",instance=~"$instance"}[$__rate_interval]))by(group)
Series Write Rate
The series write rate is the number of series write operations per second. It is calculated by summing the total number of series write operations for measures and streams. It’s grouped by the group tag.
If the value surges, it may indicate that the old series are being updated frequently by the new series. It may be caused by the high cardinality of the series and bring following problems:
- Increase the series inverted index size
- Slow down the query performance
Expression1: sum(rate(banyandb_measure_inverted_index_total_updates{job=~\"$job\",instance=~\"$instance\"}[$__rate_interval])) by (group)
Expression2: sum(rate(banyandb_stream_storage_inverted_index_total_updates{job=~\"$job\",instance=~\"$instance\"}[$__rate_interval])) by (group)
Series Term Search Rate
The series term search rate is the number of series term search operations per second. It is calculated by summing the total number of series term search operations for measures and streams. It’s grouped by the group tag.
If the value is too large, it may indicate that reading operation fetch too many series. It may be caused by the high cardinality of the series and bring following problems:
- Slow down the query performance
- Increase the CPU usage
- Increase the memory usage
Expression1: sum(rate(banyandb_stream_storage_inverted_index_total_term_searchers_started{job=~\"$job\",instance=~\"$instance\"}[$__rate_interval])) by (group)
Expression2: sum(rate(banyandb_measure_inverted_index_total_term_searchers_started{job=~\"$job\",instance=~\"$instance\"}[$__rate_interval])) by (group)
Total Series
The total series is the total number of series stored in BanyanDB. It’s grouped by the group tag.
If the value is too large, it may indicate that the high cardinality of the series. It may bring following problems:
- Increase the series inverted index size
- Slow down the query performance
Expression1: sum(banyandb_measure_inverted_index_total_doc_count{job=~\"$job\",instance=~\"$instance\"}) by (group)
Expression2: sum(banyandb_stream_storage_inverted_index_total_doc_count{job=~\"$job\",instance=~\"$instance\"}) by (group)
Stream Inverted Index
Stream Inverted Index metrics are used to monitor the stream inverted index status of BanyanDB. The following metrics are available:
Stream Inverted Index Write Rate
The write rate is the number of write operations per second. It is calculated by summing the total number of written operations for streams. It’s grouped by the group tag.
If the value is too large, it may indicate that too many data points are being indexed and bring following problems:
- Increase the inverted index size
- Slow down the query performance
- Increase the CPU usage
- Increase the memory usage
Expression: sum(rate(banyandb_stream_tst_inverted_index_total_updates{job=~\"$job\",instance=~\"$instance\"}[$__rate_interval])) by (group)
Term Search Rate
The term search rate is the number of term search operations per second. It is calculated by summing the total number of term search operations for streams. It’s grouped by the group tag.
If the value is too large, it may indicate that reading operation fetch too many data points. It may bring following problems:
- Slow down the query performance
- Increase the CPU usage
- Increase the memory usage
Expression: sum(rate(banyandb_stream_tst_inverted_index_total_term_searchers_started{job=~\"$job\",instance=~\"$instance\"}[$__rate_interval])) by (group)
Total Documents
The total documents is the total number of documents stored in the stream inverted index. It’s grouped by the group tag.
If the value is too large, it may indicate that too many data points are being indexed and bring following problems:
- Increase the inverted index size
- Slow down the query performance
- Increase the CPU usage
- Increase the memory usage
Expression: sum(banyandb_stream_tst_inverted_index_total_doc_count{job=~\"$job\",instance=~\"$instance\"}) by (group)
Liaison internal queue (queue_sub / queue_pub)
Liaison nodes run an internal gRPC queue server (server-queue-sub, wired via sub.NewServerWithPorts in pkg/cmdsetup/liaison.go) and queue clients (server-queue-pub) for tier-1/tier-2 pipelines. Prometheus metrics use the namespaces banyandb_queue_sub_* and banyandb_queue_pub_* (built from observability.RootScope + queue_sub / queue_pub sub-scopes). Data nodes may expose the same metric families where the corresponding services run.
queue_sub — inbound server (including chunked sync)
Metric (suffix after banyandb_queue_sub_) |
Type | Labels | Meaning |
|---|---|---|---|
total_started, total_finished, total_err, total_latency |
Counter | topic |
Legacy per-topic stream handler lifecycle. |
total_msg_received, total_msg_received_err, total_msg_sent, total_msg_sent_err |
Counter | topic |
Per-topic message I/O errors (included in high-level error rates below). |
out_of_order_chunks_received, chunks_buffered |
Counter | topic |
Chunk reordering: out-of-order arrivals and buffer events (topic only, not per session). |
buffer_timeouts, large_gaps_rejected, buffer_capacity_exceeded, finish_sync_err |
Counter | topic |
Reorder buffer pressure and sync completion issues. |
chunked_sync_active_sessions |
Gauge | topic |
In-flight chunked sync sessions per topic. |
chunk_reorder_buffered_chunks |
Gauge | topic |
Chunks waiting in the reorder buffer. |
chunked_sync_aborted_total |
Counter | topic, reason |
Aborted sessions; reason is one of switch, stream_error, ctx_done, eof. |
chunked_sync_failed_parts_total |
Counter | topic |
Parts incomplete when a sync completes. |
chunked_sync_total_bytes_received |
Counter | topic |
Bytes received for completed syncs. |
chunked_sync_duration_seconds |
Histogram | topic |
Wall-clock duration of completed syncs. |
Troubleshooting: rising chunk_reorder_buffered_chunks or buffer_timeouts suggests sustained out-of-order or slow consumers. Spikes in chunked_sync_aborted_total with reason=switch often correlate with topic/hand-off changes; stream_error / ctx_done / eof point to RPC lifecycle issues. Use chunked_sync_failed_parts_total and the duration histogram to separate partial completion from healthy throughput.
queue_pub — outbound batch client
Metric (suffix after banyandb_queue_pub_) |
Type | Labels | Meaning |
|---|---|---|---|
send_success_total |
Counter | topic, node |
Successful Send on the client stream (local write, not end-to-end ack). |
send_bytes_total |
Counter | topic, node |
Payload bytes on successful Send. |
send_duration_seconds |
Histogram | topic, node, result |
Time spent in the send path including retries. result is one of success, non_transient, canceled, stream_canceled, retry_exhausted; filter to result="success" (and optionally retry_exhausted) when isolating end-to-end send latency. |
send_err_total |
Counter | topic, node, reason |
Send/recv side errors; reason includes non_transient, canceled, stream_canceled, retry_exhausted, recv_error, server_rejected. |
send_retry_attempts_total, send_retry_exhausted_total, send_backoff_seconds_total |
Counter | topic, node |
Retry/backoff behavior before giving up. |
inflight_streams |
Gauge | node |
Open send streams per downstream node. |
inflight_requests |
Gauge | topic, node |
In-flight batch send operations. |
Troubleshooting: correlate send_retry_exhausted_total and send_err_total{reason="retry_exhausted"} with upstream pressure. recv_error vs server_rejected separates transport failures from application-level SendResponse errors. Sustained high inflight_requests or inflight_streams may indicate slow or unavailable data nodes.
Metrics are only registered when metadata implements metadata.Service and MetricsRegistry() is non-nil (e.g. after SetMetricsRegistry in bootstrap). NewWithoutMetadata() leaves queue_pub metrics disabled without a warning.
Example PromQL snippets
Saturation (liaison pod / job variables as in the cluster dashboard):
- Chunked sync sessions:
sum(banyandb_queue_sub_chunked_sync_active_sessions{job=~"$job",pod=~"$pod"}) by (topic) - Reorder buffer depth:
sum(banyandb_queue_sub_chunk_reorder_buffered_chunks{job=~"$job",pod=~"$pod"}) by (topic) - Chunked sync abort rate:
sum(rate(banyandb_queue_sub_chunked_sync_aborted_total{job=~"$job",pod=~"$pod"}[$__rate_interval])) by (topic,reason) - Publisher success rate:
sum(rate(banyandb_queue_pub_send_success_total{job=~"$job",pod=~"$pod"}[$__rate_interval])) by (topic) - Publisher errors by reason:
sum(rate(banyandb_queue_pub_send_err_total{job=~"$job",pod=~"$pod"}[$__rate_interval])) by (reason)
Suggested alerts (tune thresholds per cluster):
- Non-zero sustained
rate(banyandb_queue_pub_send_retry_exhausted_total[5m])on liaison. chunk_reorder_buffered_chunksorchunked_sync_active_sessionsabove an environment-specific ceiling for a singletopic.
Aggregate pipeline error rate (optional)
To combine legacy queue stream errors with publisher-side failures (per minute scaling as elsewhere in this doc):
Expression: sum(rate(banyandb_queue_sub_total_msg_sent_err{job=~"$job",instance=~"$instance"}[$__rate_interval])*60) + sum(rate(banyandb_queue_sub_total_msg_received_err{job=~"$job",instance=~"$instance"}[$__rate_interval])*60) + sum(rate(banyandb_queue_pub_send_err_total{job=~"$job",instance=~"$instance"}[$__rate_interval])*60)
Metrics Providers
BanyanDB has built-in support for metrics collection. Currently, there are two supported metrics provider: prometheus and native. These can be enabled through observability-modes flag, allowing you to activate one or both of them.
Prometheus
Prometheus is auto enabled at run time, if no flag is passed or if promethus is set in observability-modes flag.
When the Prometheus metrics provider is enabled, the metrics server listens on port 2121. This allows Prometheus to scrape metrics data from BanyanDB for monitoring and analysis.
Next, configure the following target to collect metrics from BanyanDB. Be sure to replace BANYANDB_NAMESPACE with the namespace where BanyanDB is deployed:
scrape_configs:
  - job_name: "banyandb"
    kubernetes_sd_configs:
      - role: pod
        namespaces:
          names: ["${BANYANDB_NAMESPACE}"]
    relabel_configs:
      - source_labels: [__meta_kubernetes_pod_label_app_kubernetes_io_name]
        action: keep
        regex: banyandb
      - source_labels: [__meta_kubernetes_pod_name]
        target_label: pod
        action: replace
      - source_labels: [__address__]
        target_label: __address__
        regex: (.*):\d+
        replacement: $1:2121
    metrics_path: /metrics
    scheme: http
Grafana Dashboard
Check out the BanyanDB Cluster Dashboard for monitoring BanyanDB metrics. The dashboard includes a Liaison internal queue row (queue_sub saturation / aborts and queue_pub send and error rates); metric names and PromQL examples are documented in the Liaison internal queue subsection above.
Native
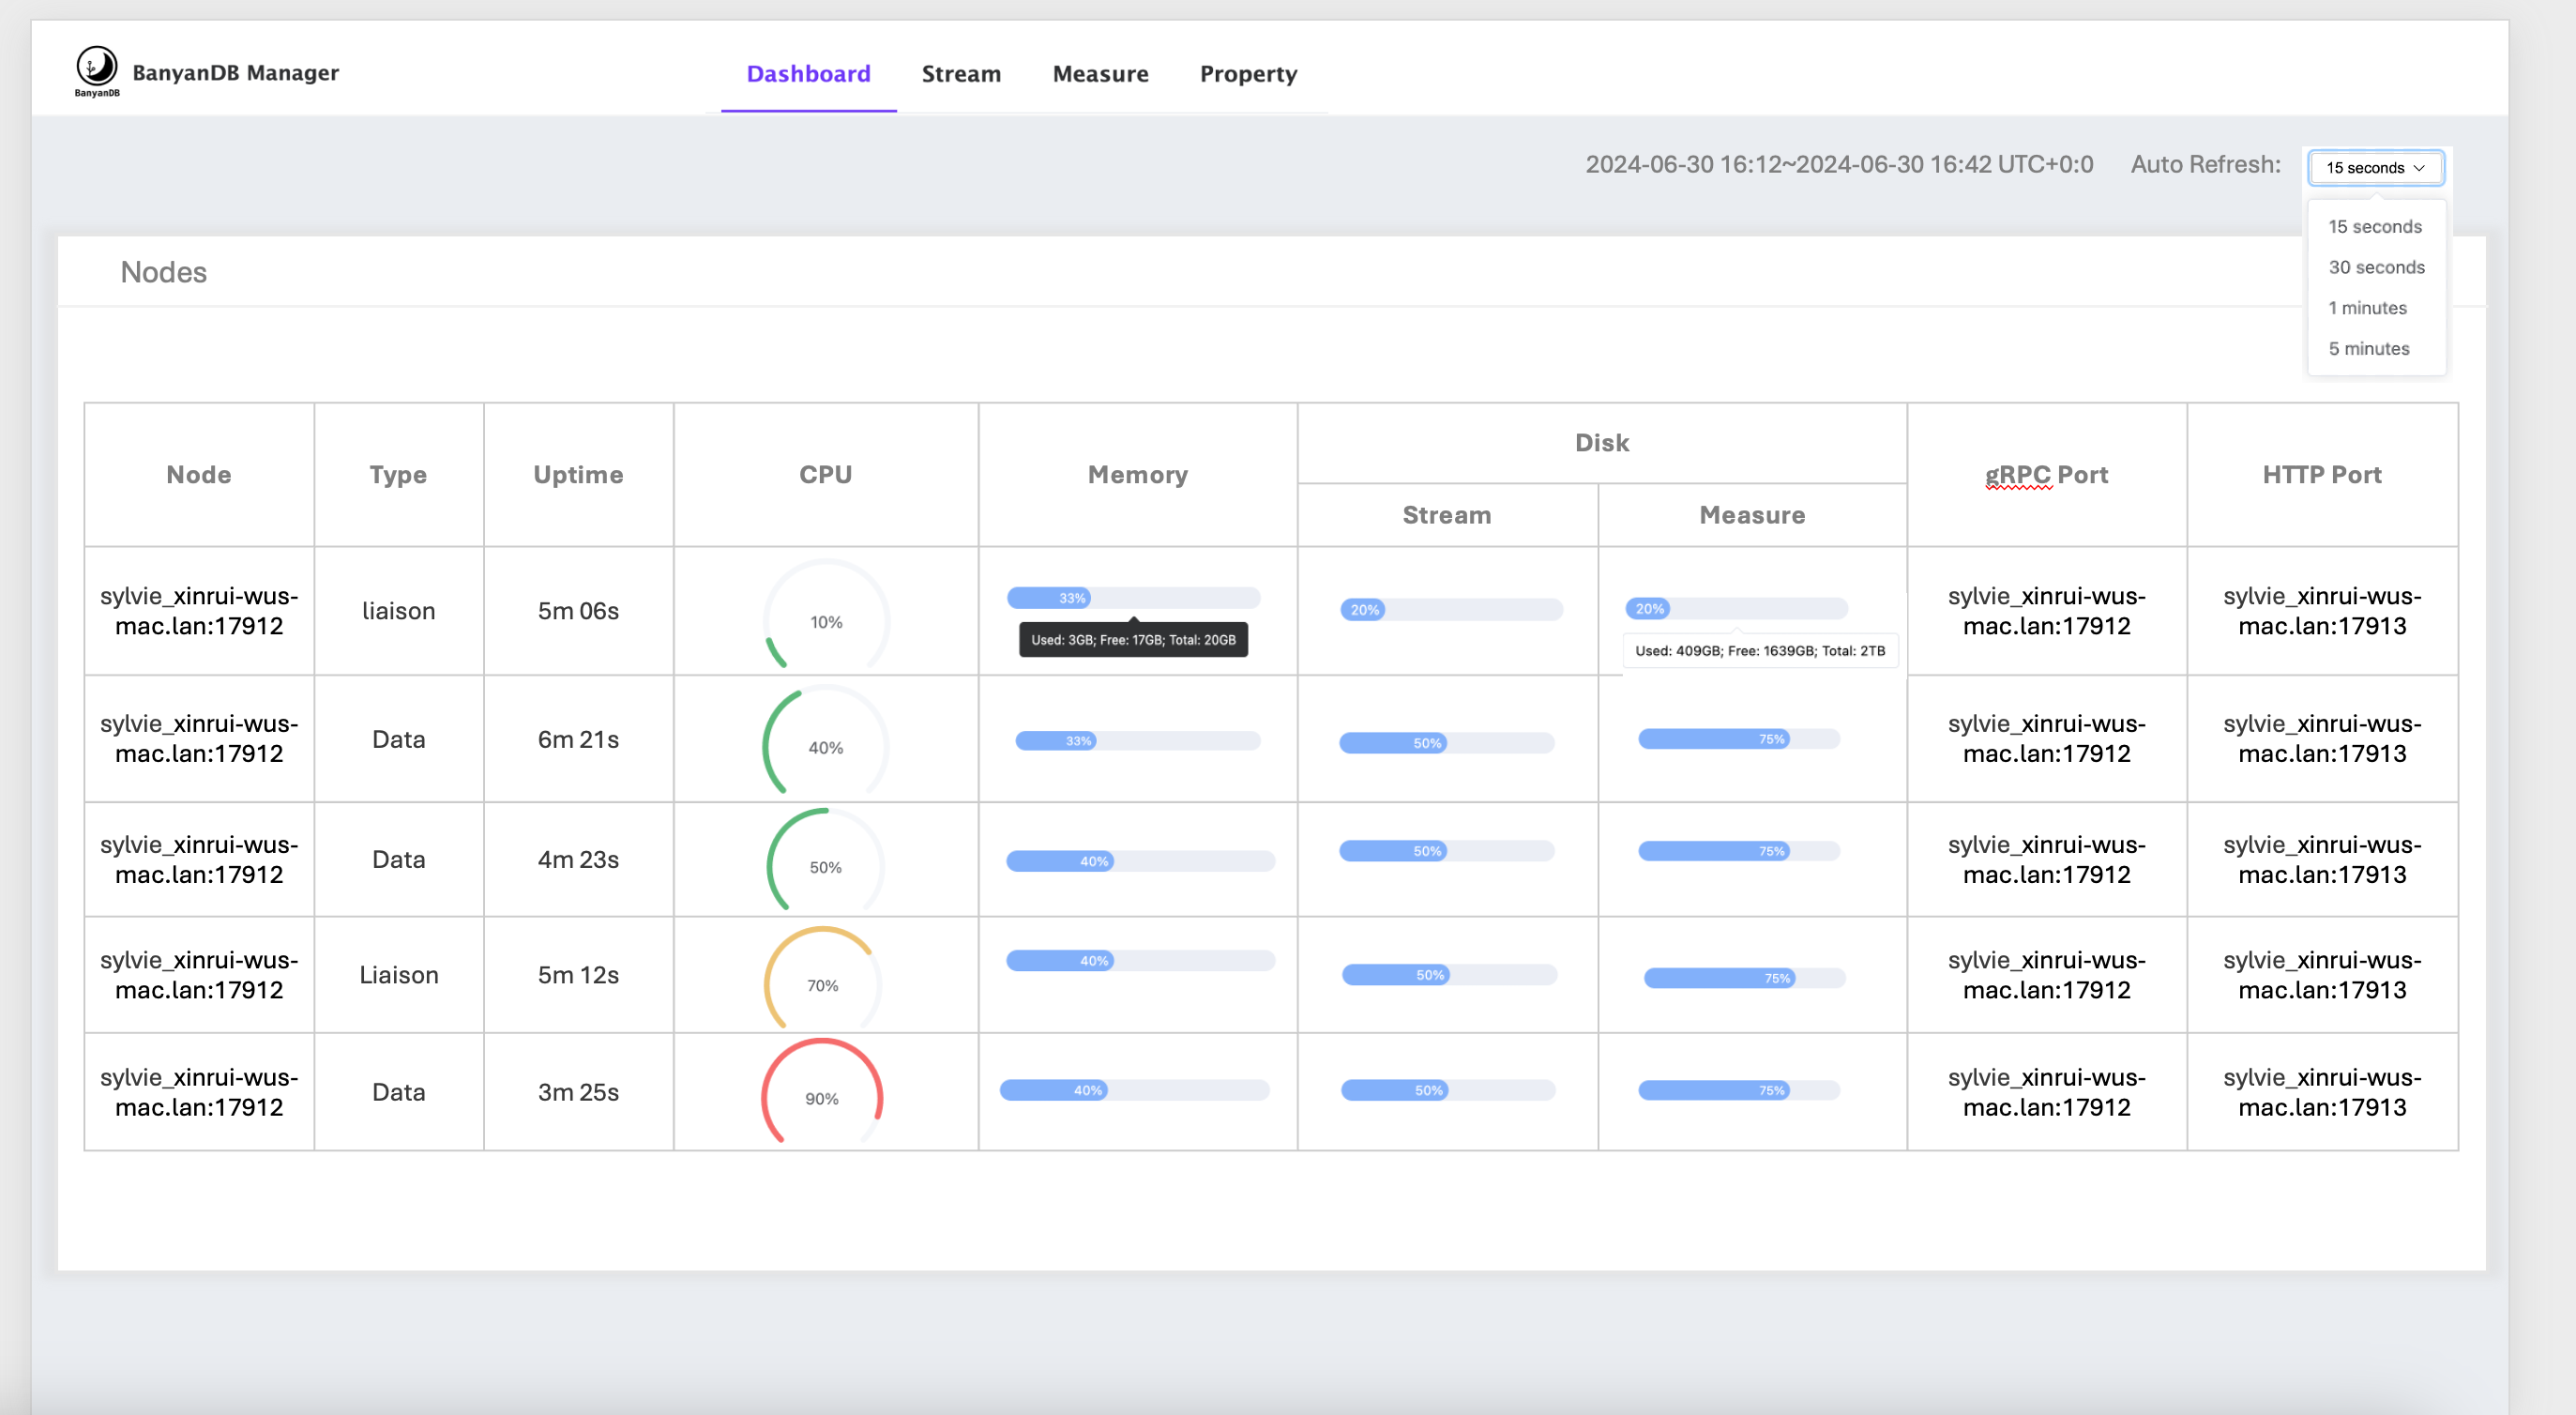
If the observability-modes flag is set to native, the self-observability metrics provider will be enabled. Some of the metrics will be displayed in the dashboard of banyandb-ui
Metrics storage
In self-observability, the metrics data is stored in BanyanDB within the _monitoring internal group. Each metric will be created as a new measure within this group.
You can use BanyanDB-UI or bydbctl to retrieve the data.
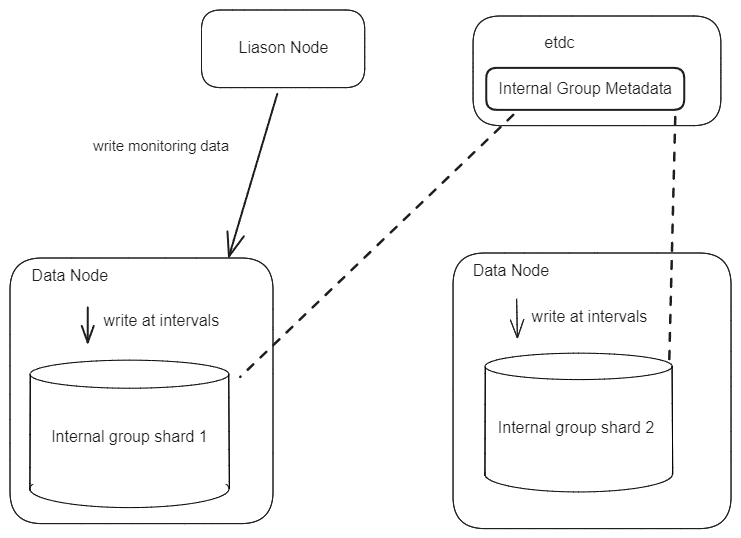
Write Flow
When starting any node, the _monitoring internal group will be created, and the metrics will be created as measures within this group. All metric values will be collected and written together at a configurable fixed interval. For a data node, it will write metric values to its own shard using a local pipeline. For a liaison node, it will use nodeSelector to select a data node to write its metric data.
Read Flow
The read flow is the same as reading data from measure, with each metric being a new measure.
Profiling
Banyand, the server of BanyanDB, supports profiling automatically. The profiling data is collected by the pprof package and can be accessed through the /debug/pprof endpoint. The port of the profiling server is 2122 by default.
Refer to the pprof documentation for more information on how to use the profiling data.
Query Tracing
BanyanDB supports query tracing, which allows you to trace the execution of a query. The tracing data includes the query plan, execution time, and other useful information. You can enable query tracing by setting the QueryRequest.trace field to true when sending a query request.
The below command could query data in the last 30 minutes with trace enabled:
bydbctl measure query --start -30m -f - <<EOF
name: "service_cpm_minute"
groups: ["measure-minute"]
tagProjection:
  tagFamilies:
    - name: "storage-only"
      tags: ["entity_id"]
fieldProjection:
  names: ["total", "value"]
trace: true
EOF
The result will include the tracing data in the response. The duration time unit is in nano seconds.