Use Grafana As The UI
SkyWalking provides PromQL Service, LogQL Service and TraceQL Service. You can choose Grafana as the SkyWalking UI. About the installation and how to use please refer to the official document.
Notice <1>, Gafana is AGPL-3.0 license, which is very different from Apache 2.0. Please follow AGPL 3.0 license requirements.
Notice <2>, SkyWalking always uses its native UI as first class. All visualization features are only available on native UI. Grafana UI is an extension on our support of PromQL APIs. We don’t maintain or promise the complete Grafana UI dashboard setup.
Configure Data Source
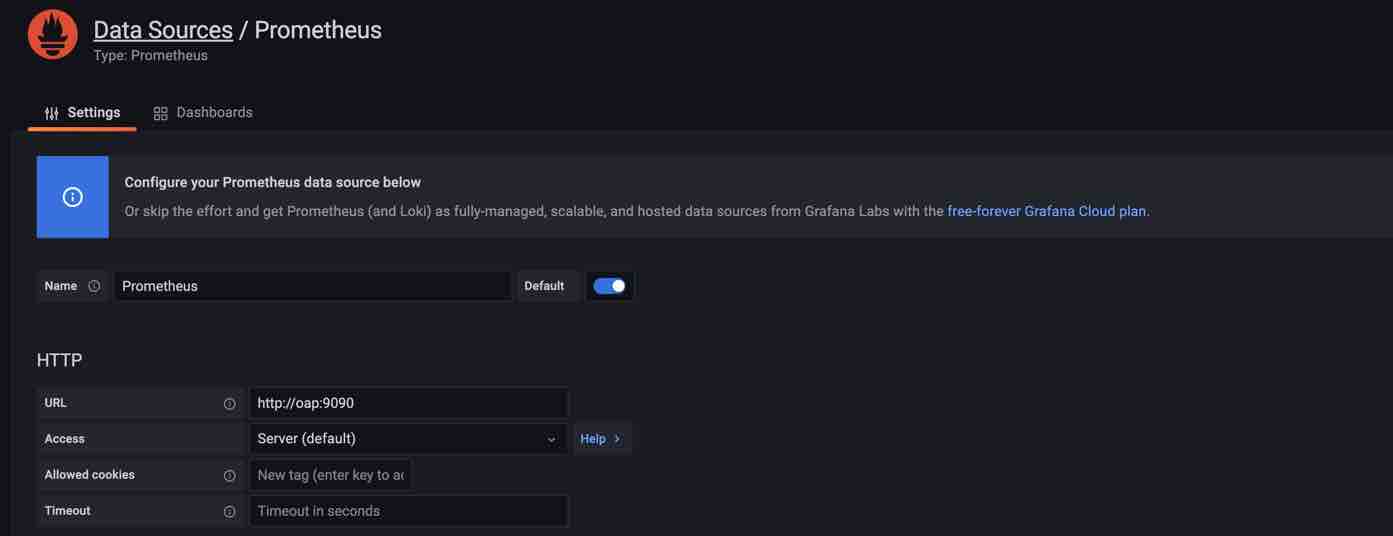
Prometheus Data Source
In the data source config panel, choose the Prometheus and set the url to the OAP server address, the default port is 9090.
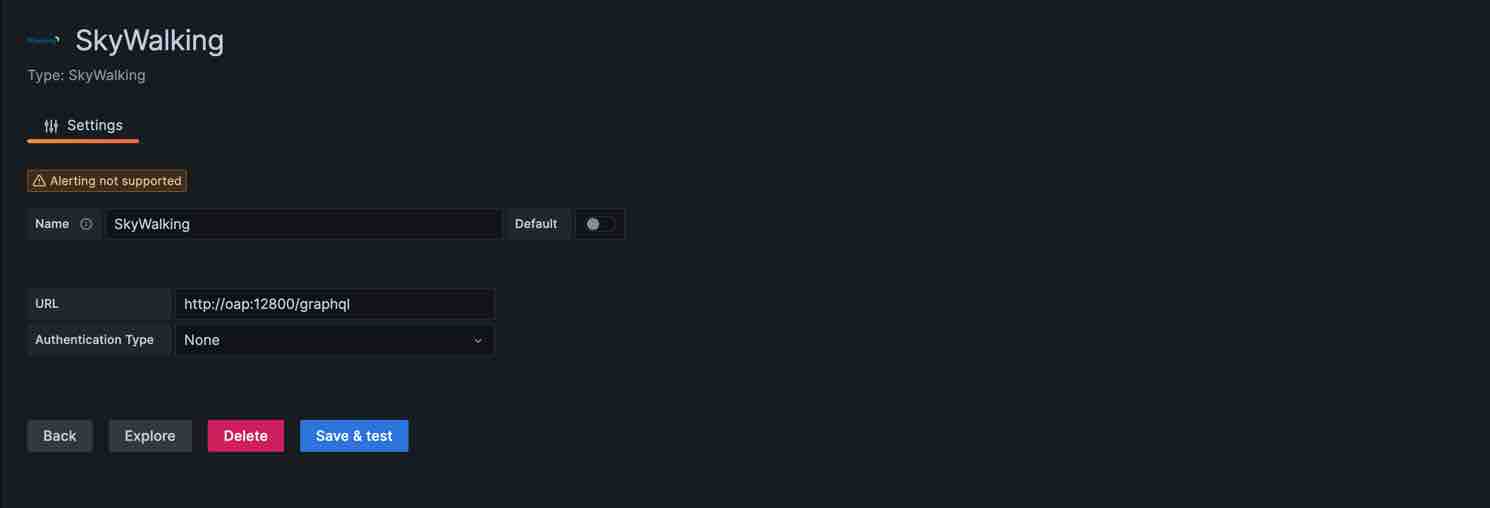
SkyWalking Data Source
Before you start, please install the SkyWalking data source plugin.
In the data source config panel, choose the SkyWalking and set the url to the OAP server graphql service address, the default port is 12800.
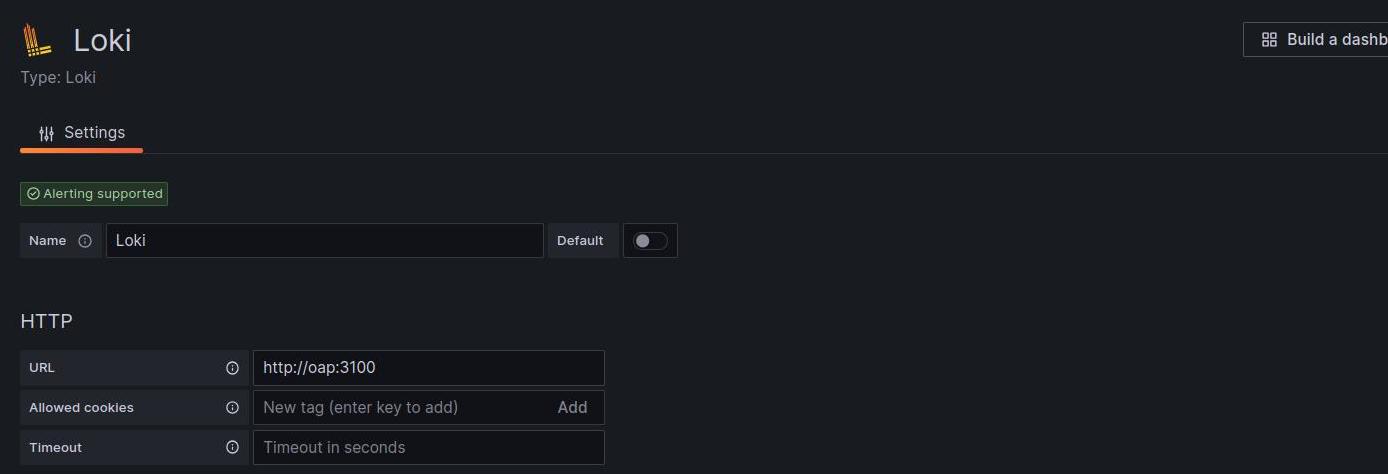
Loki Data Source
In the data source config panel, choose the Loki and set the url to the OAP server address, the default port is 3100.
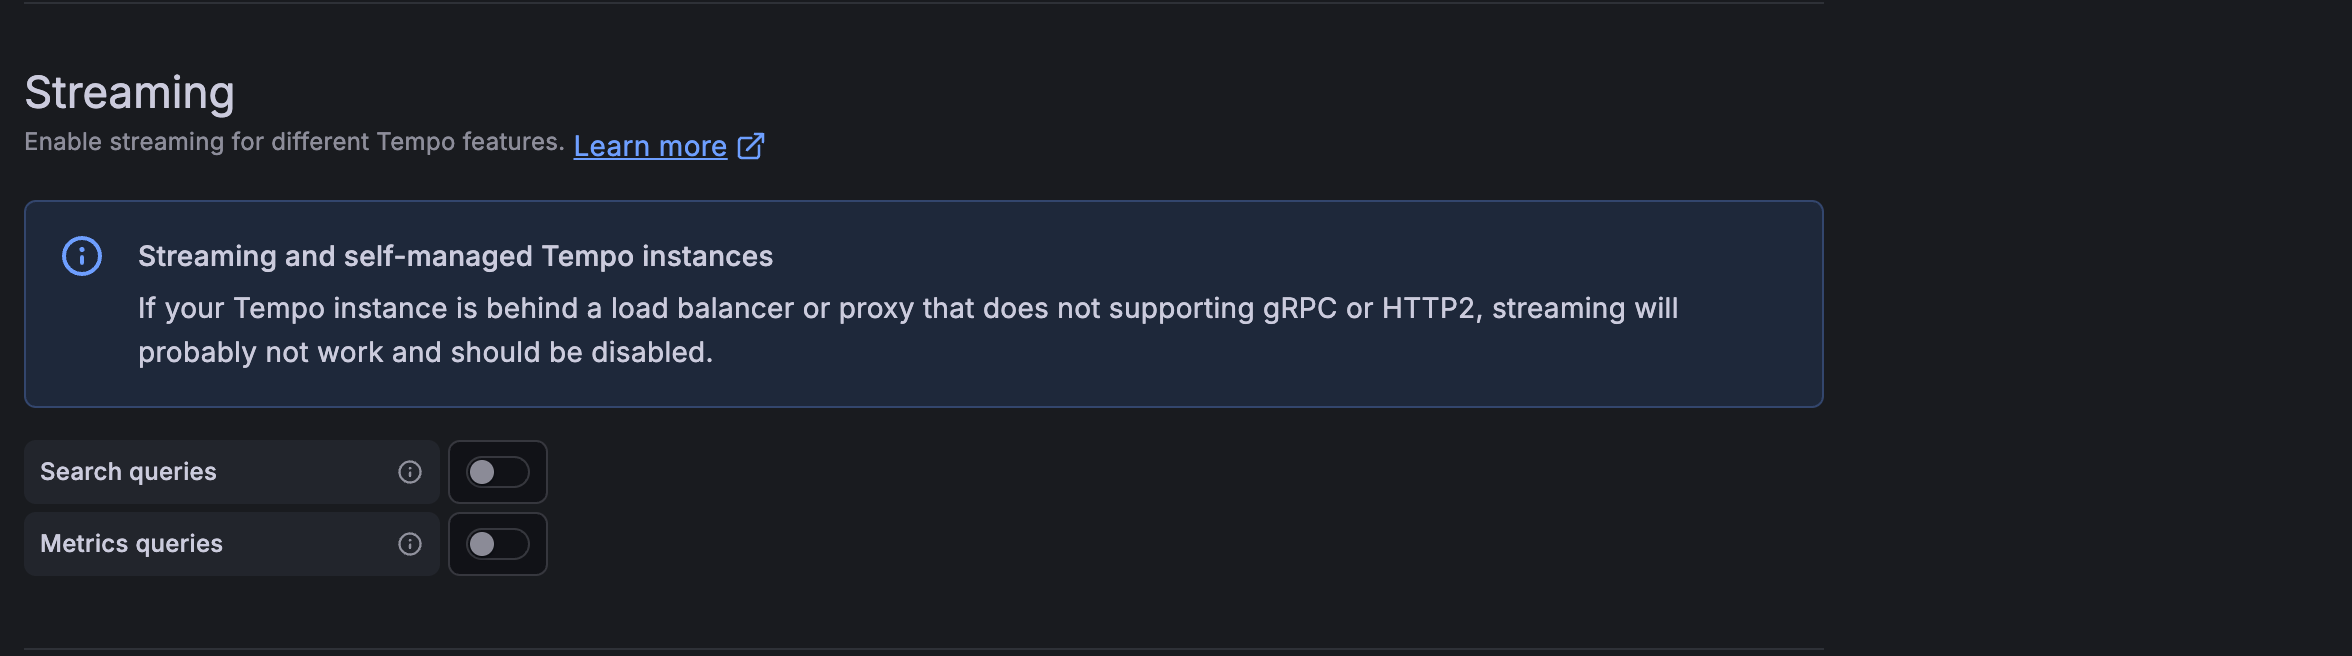
Tempo Data Source
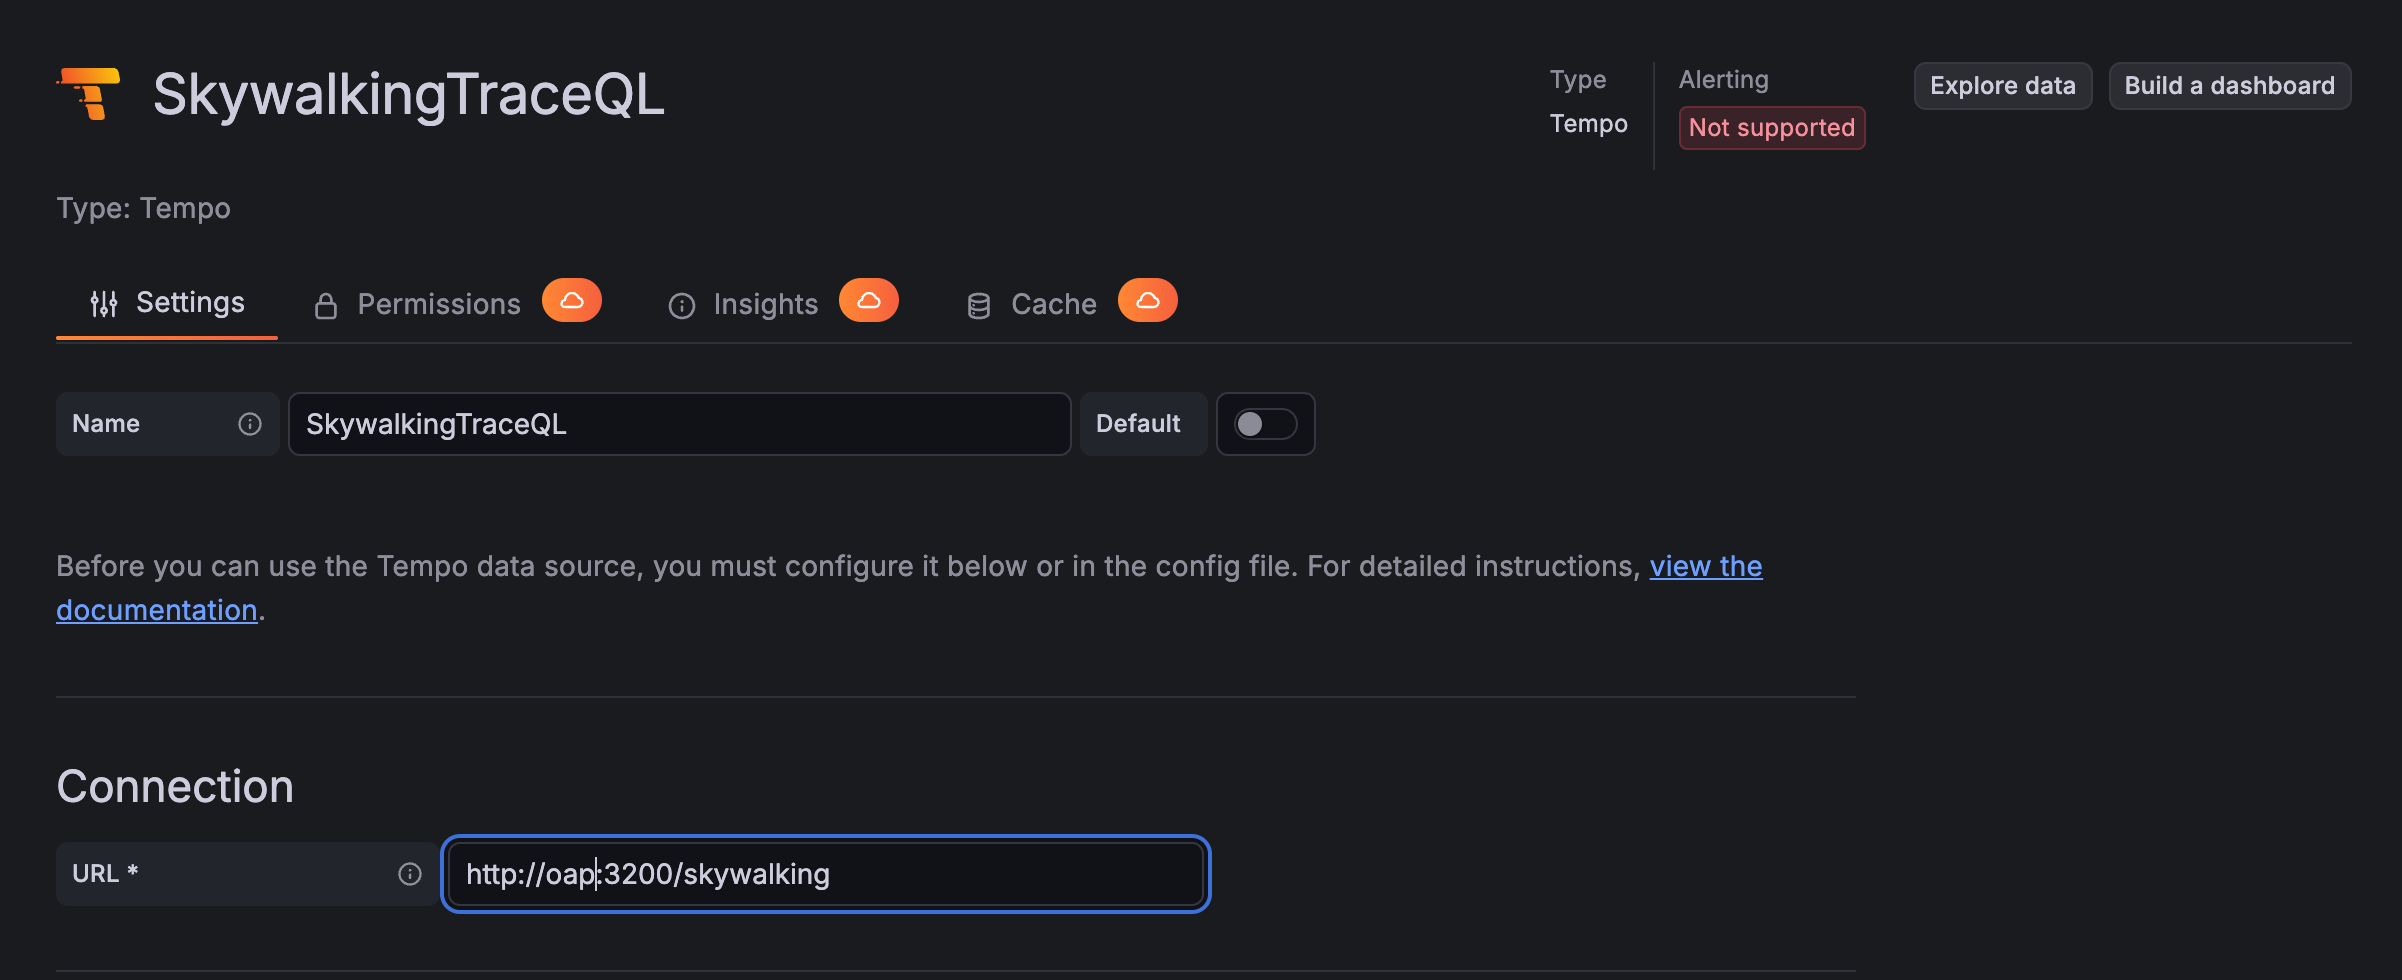
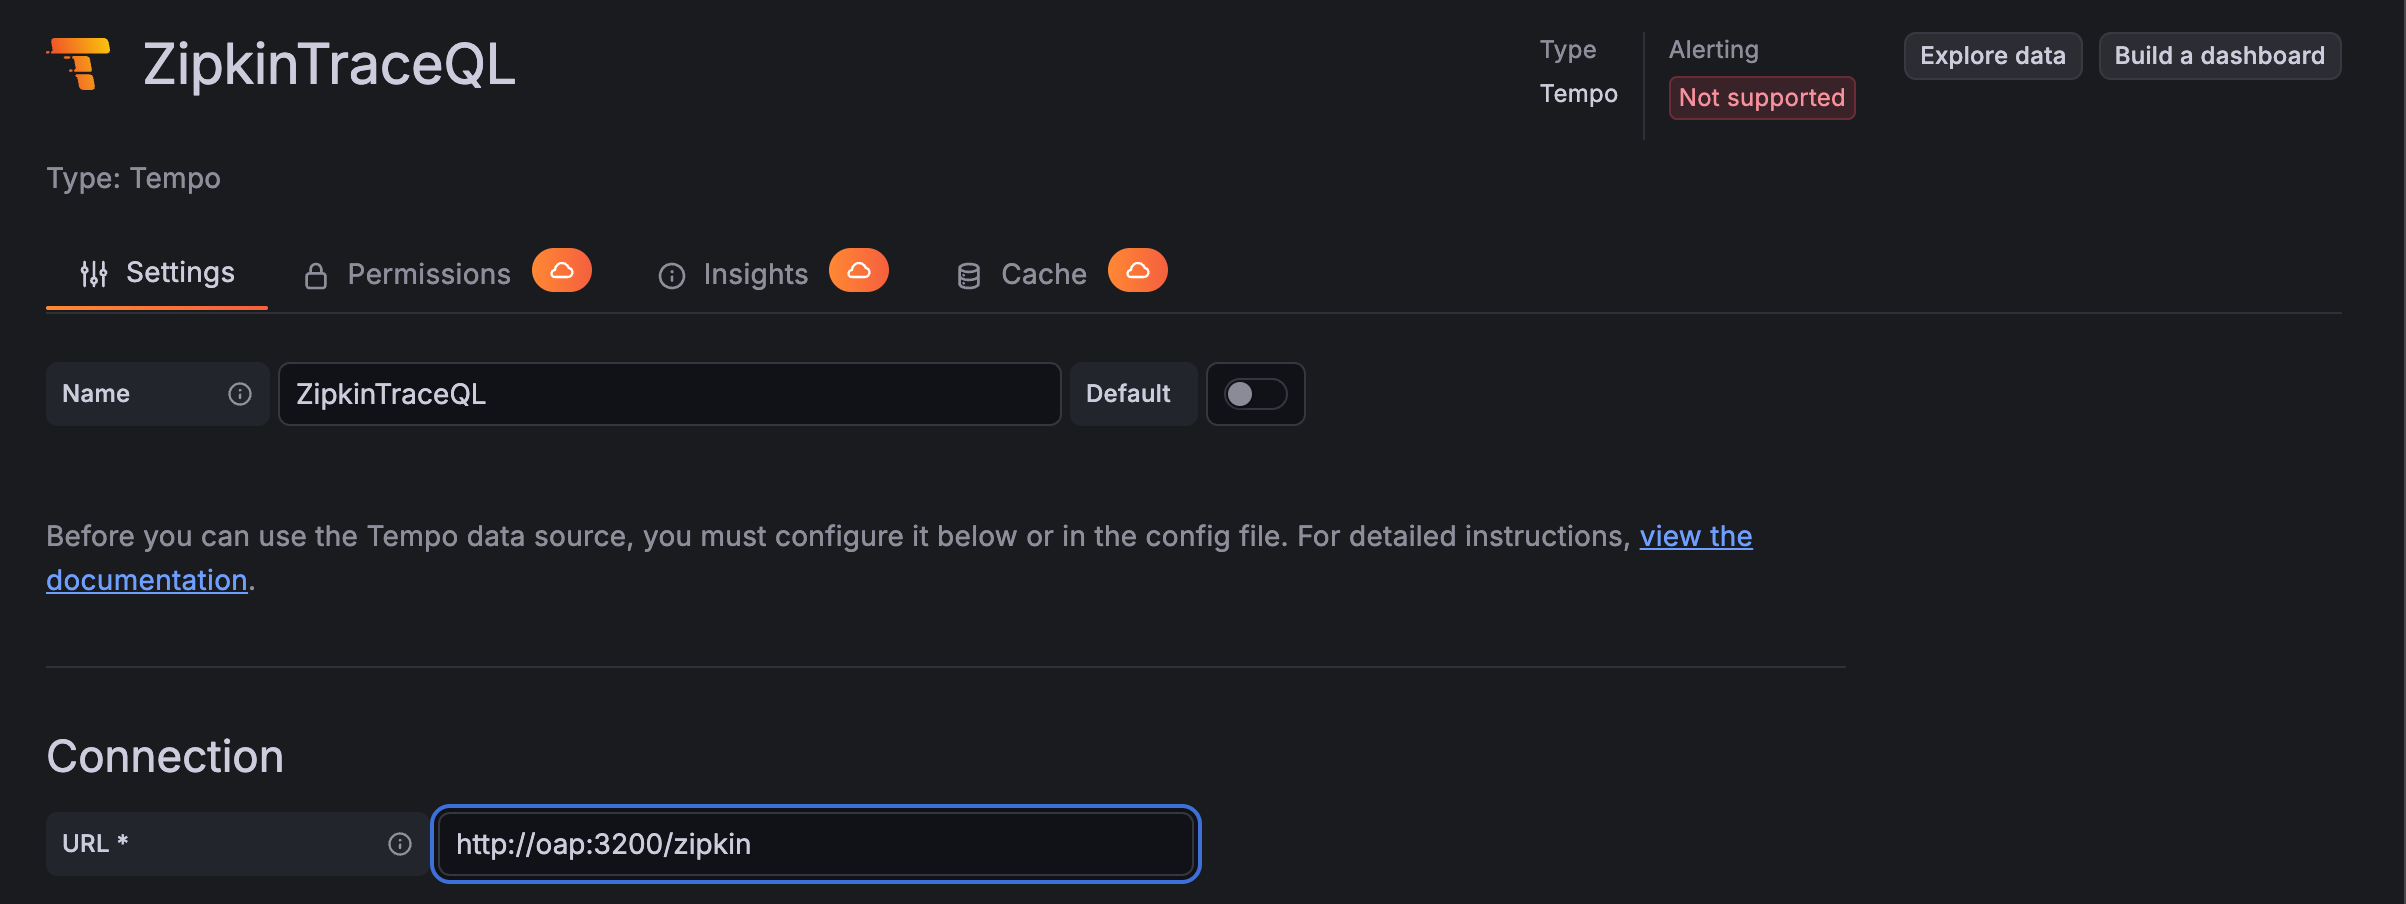
In the data source config panel, choose the Tempo and set the url to the full OAP trace API address, including the context path. The default port is 3200, for example http://<oap-host>:3200/skywalking for SkyWalking native trace or http://<oap-host>:3200/zipkin for Zipkin trace.
The SkyWalking native trace API context path is /skywalking, and the Zipkin trace API context path is /zipkin.
You can customize them via SW_TRACEQL_REST_CONTEXT_PATH_SKYWALKING and SW_TRACEQL_REST_CONTEXT_PATH_ZIPKIN respectively. If you customize either path, use the customized path in the Grafana Tempo data source URL.
Notice: The feature requires version Grafana 12 or later. And require disabling the Streaming option for the Tempo data source in the following configuration.
SkyWalking Native Trace
Zipkin Trace
Configure Metric Dashboards
Dashboards Settings
The following steps are the example of config a General Service dashboard:
- Create a dashboard named
General Service. A layer is recommended as a dashboard. - Configure variables for the dashboard:
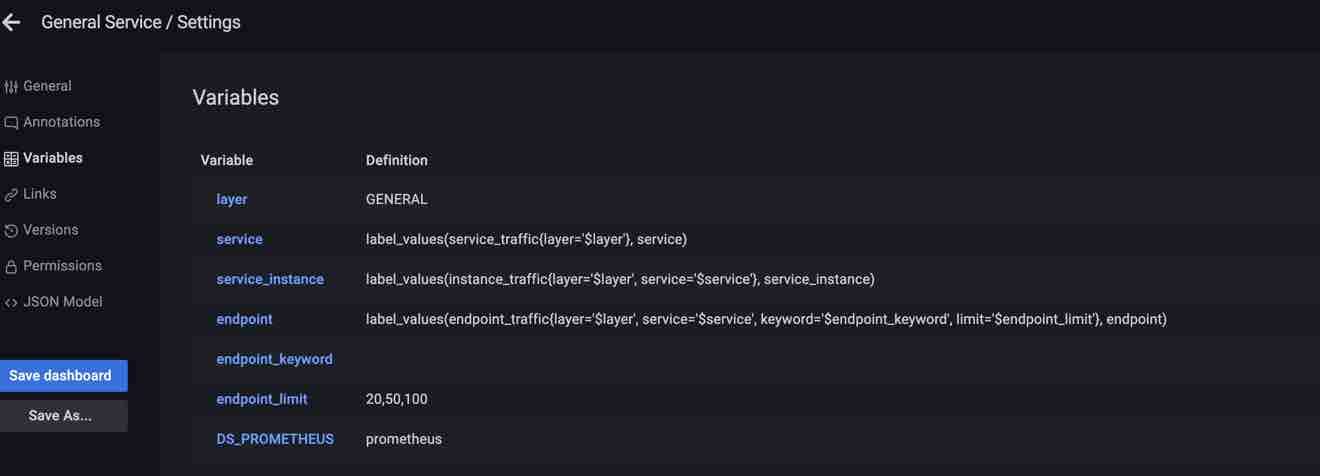 After configure, you can select the service/instance/endpoint on the top of the dashboard:

Add Panels
The following contents show how to add several typical metrics panels. General settings:
- Chose the metrics and chart.
- Set
Query options --> Min interval = 1m, because the metrics min time bucket in SkyWalking is 1m. - Add PromQL expressions, use the variables configured above for the labels then you can select the labels value from top. Note: Some metrics values may be required calculations to match units.
- Select the returned labels you want to show on panel.
- Test query and save the panel.
Common Value Metrics
- For example
service_apdexandTime series chart. - Add PromQL expression, the metric scope is
Service, so add labelsserviceandlayerfor match. - Set
Connect null values --> AlwaysandShow points --> Alwaysbecause when the query interval > 1hour or 1day SkyWalking return the hour/day step metrics values.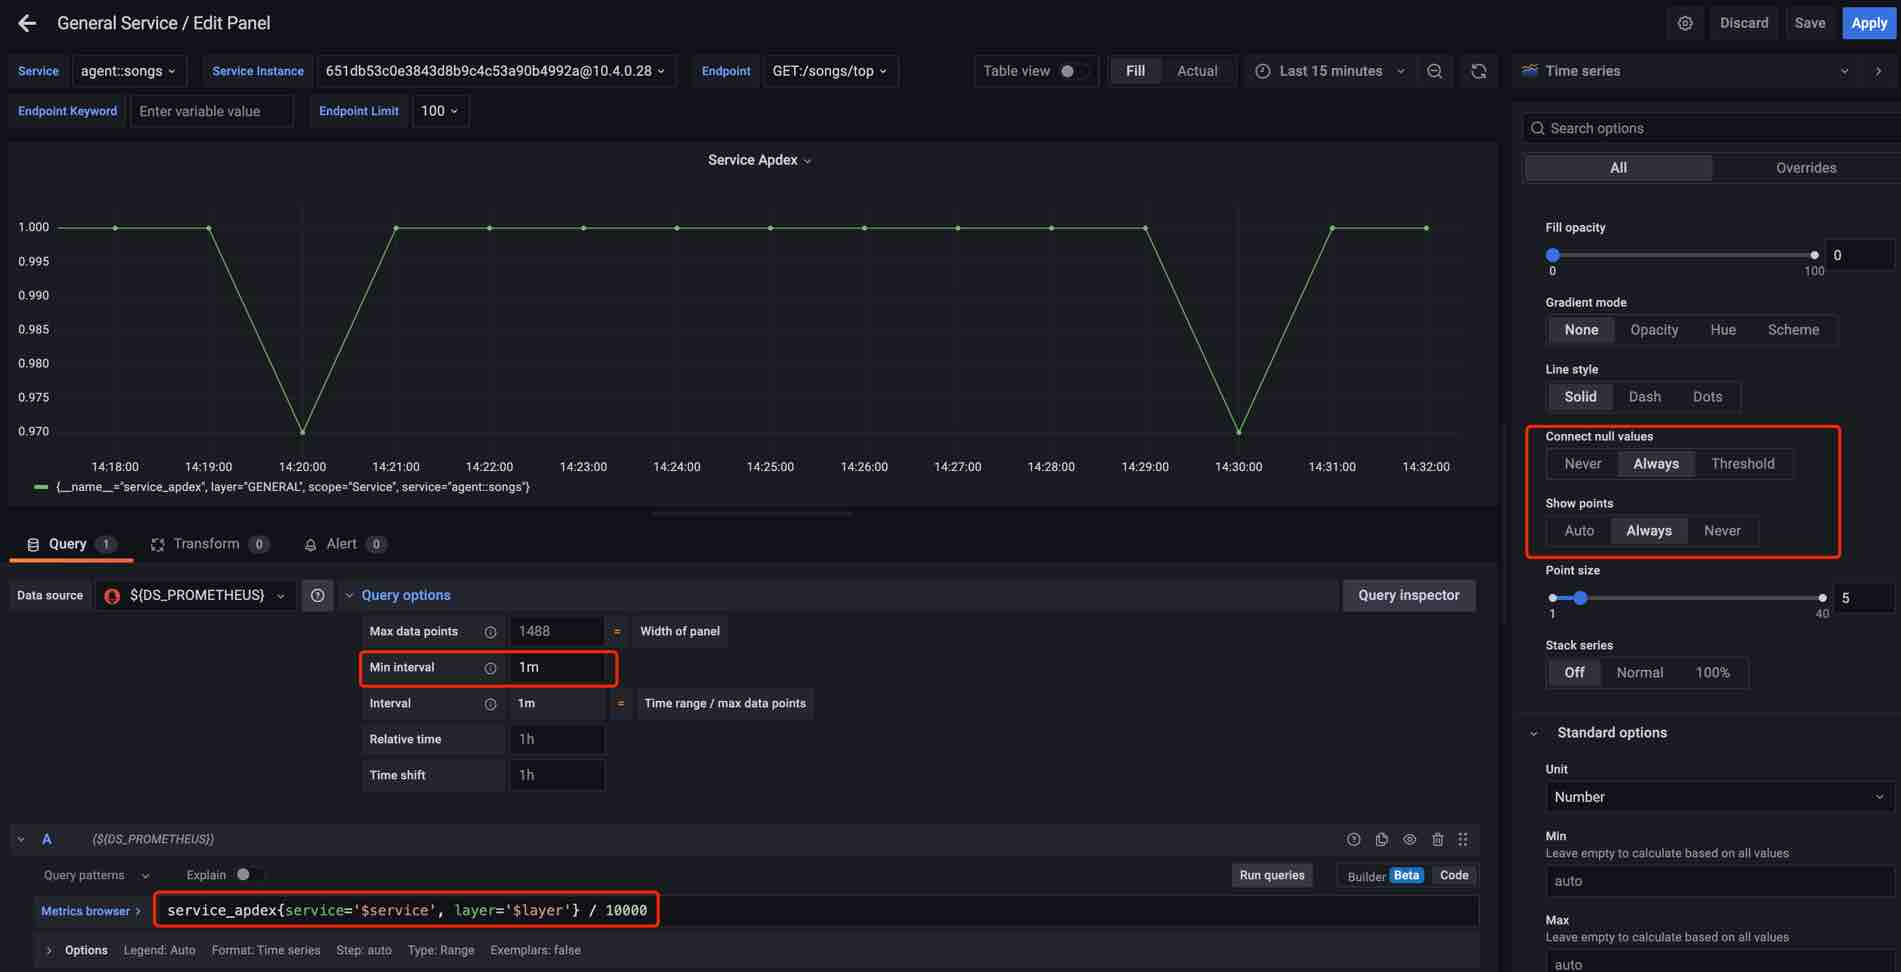
Labeled Value Metrics
- For example
service_percentileandTime series chart. - Add PromQL expressions, the metric scope is
Service, add labelsserviceandlayerfor match. And it’s a labeled value metric, addlabels='0,1,2,3,4'filter the result label, and addrelabels='P50,P75,P90,P95,P99'rename the result label. - Set
Connect null values --> AlwaysandShow points --> Alwaysbecause when the query interval > 1hour or 1day SkyWalking return the hour/day step metrics values.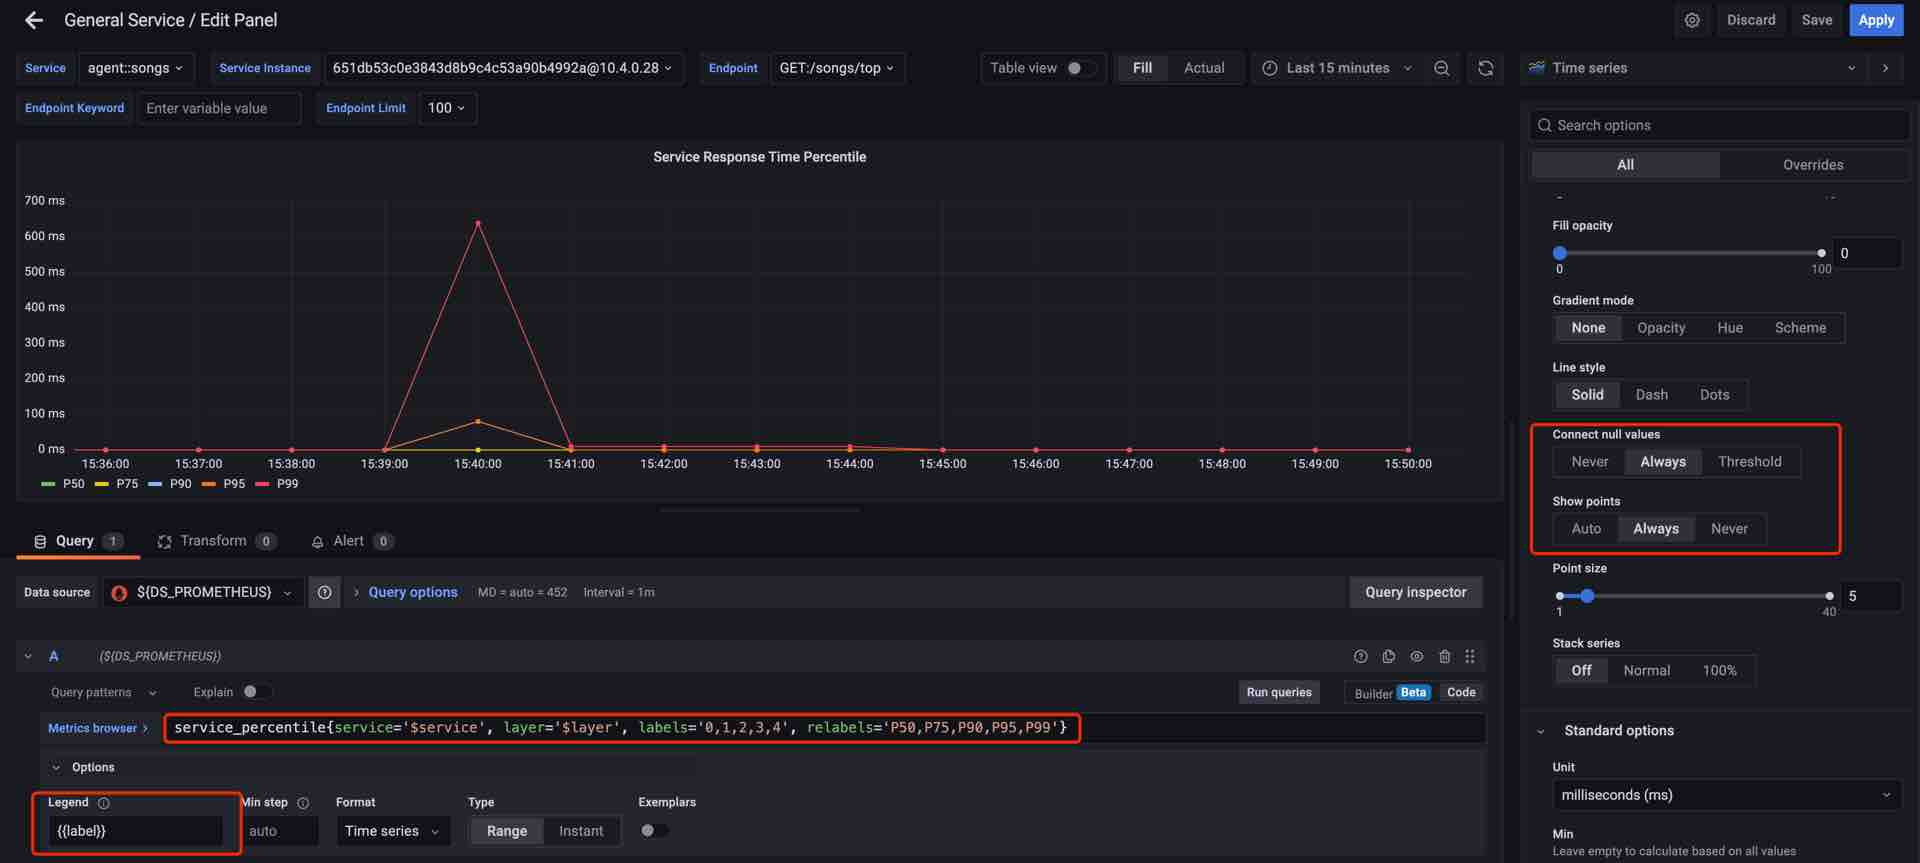
Sort Metrics
- For example
service_instance_cpmandBar gauge chart. - Add PromQL expressions, add labels
parent_serviceandlayerfor match, addtop_n='10'andorder='DES'filter the result. - Set the
Calculation --> Latest*.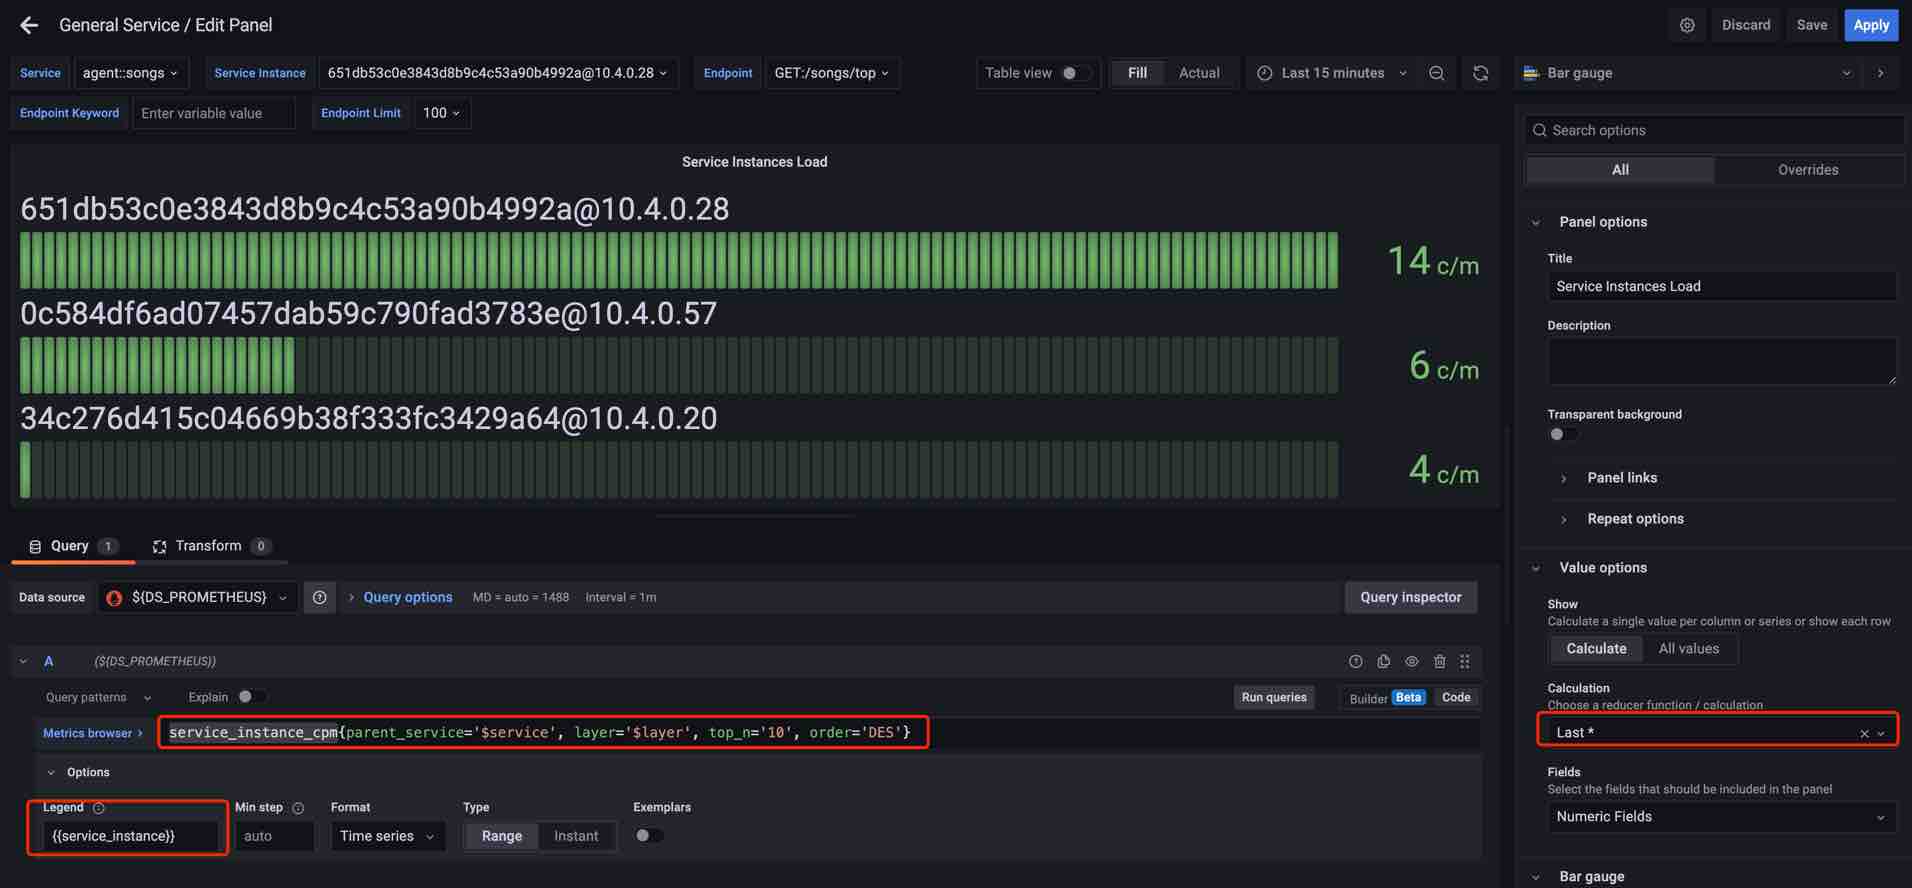
Sampled Records
Same as the Sort Metrics.
Configure Topology Dashboards
Dashboards Settings
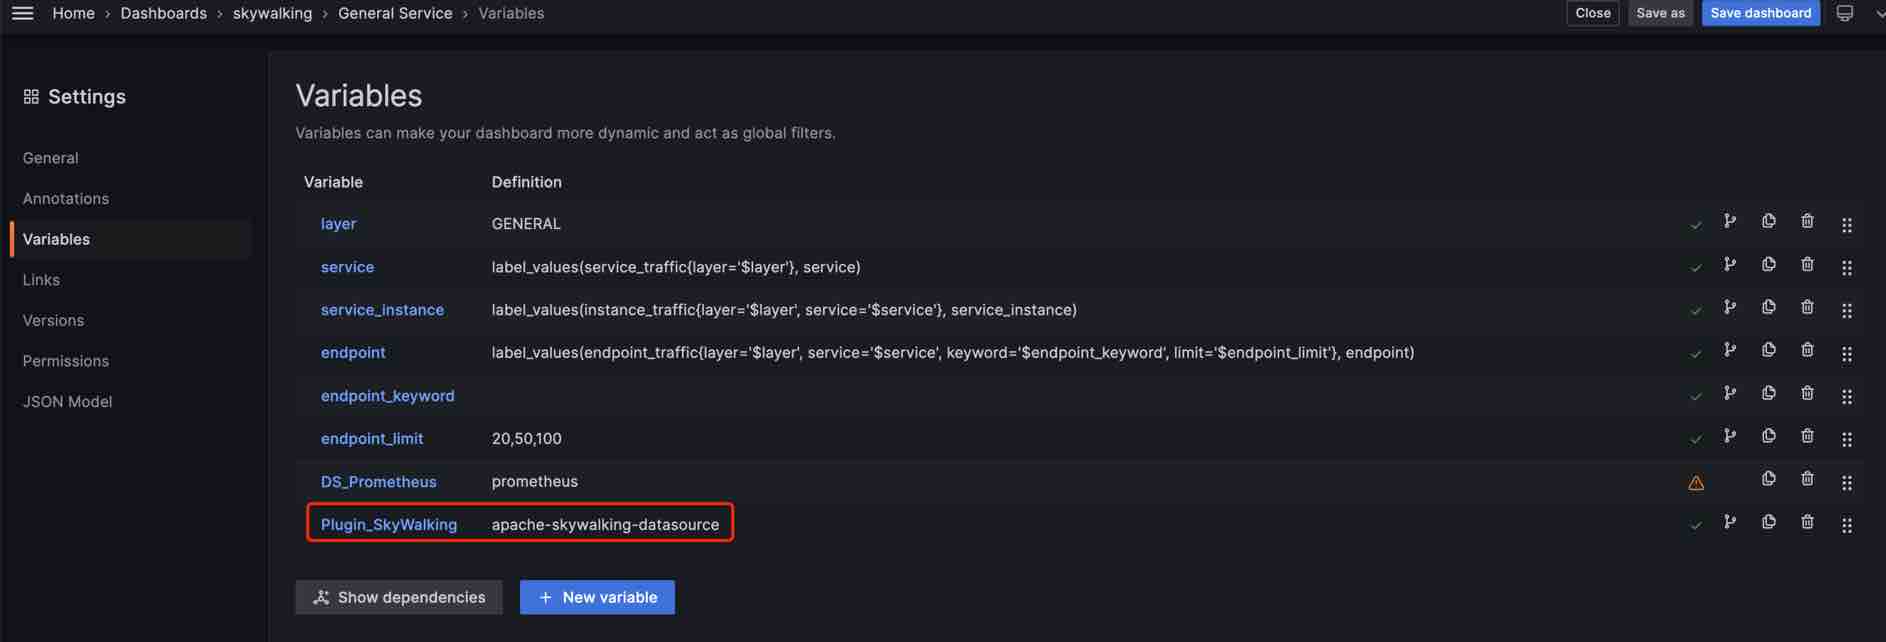
For now, SkyWalking support General Service and Service Mesh topology dashboards, the layer is GENERAL and MESH respectively.
The following configuration can reuse the above General Service dashboard and add a new variable Plugin_SkyWalking for the dashboard:
Add Topology Panel
- Chose the Node Graph chart.
- Set
LayerandServiceby the variables. If you want to show all services in this layer, setServiceempty. - Set
Node MetricsandEdge Metricswhich you want to show on the topology.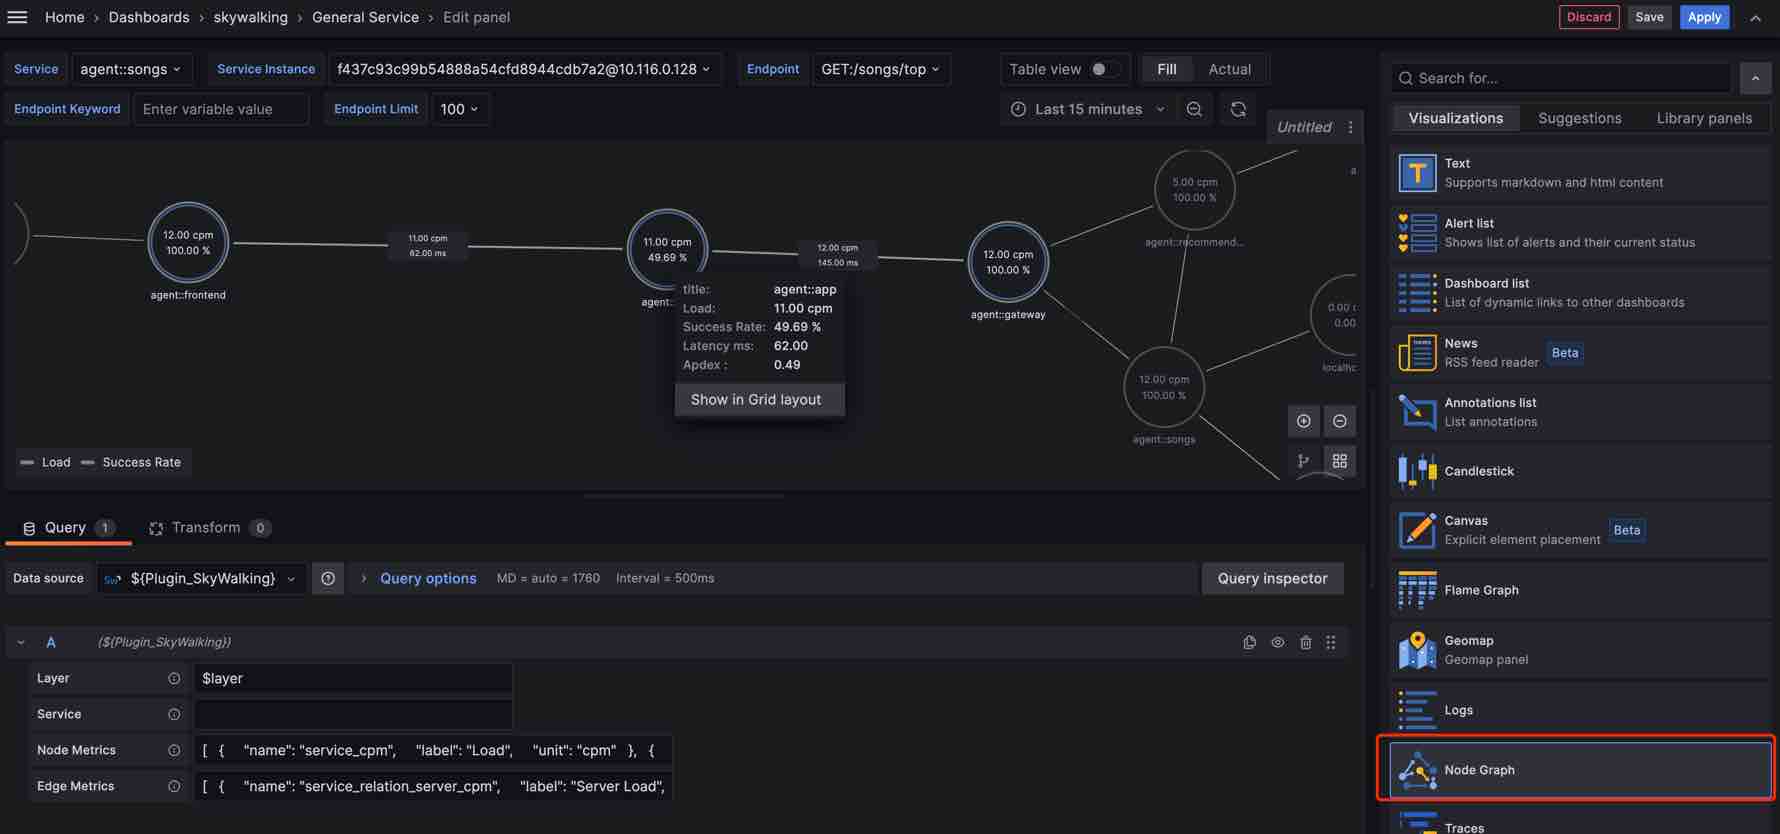
Configure Log Dashboard
Dashboards Settings
The following steps are the example of config a log dashboard:
- Create a dashboard named
Log. - Configure variables for the dashboard:
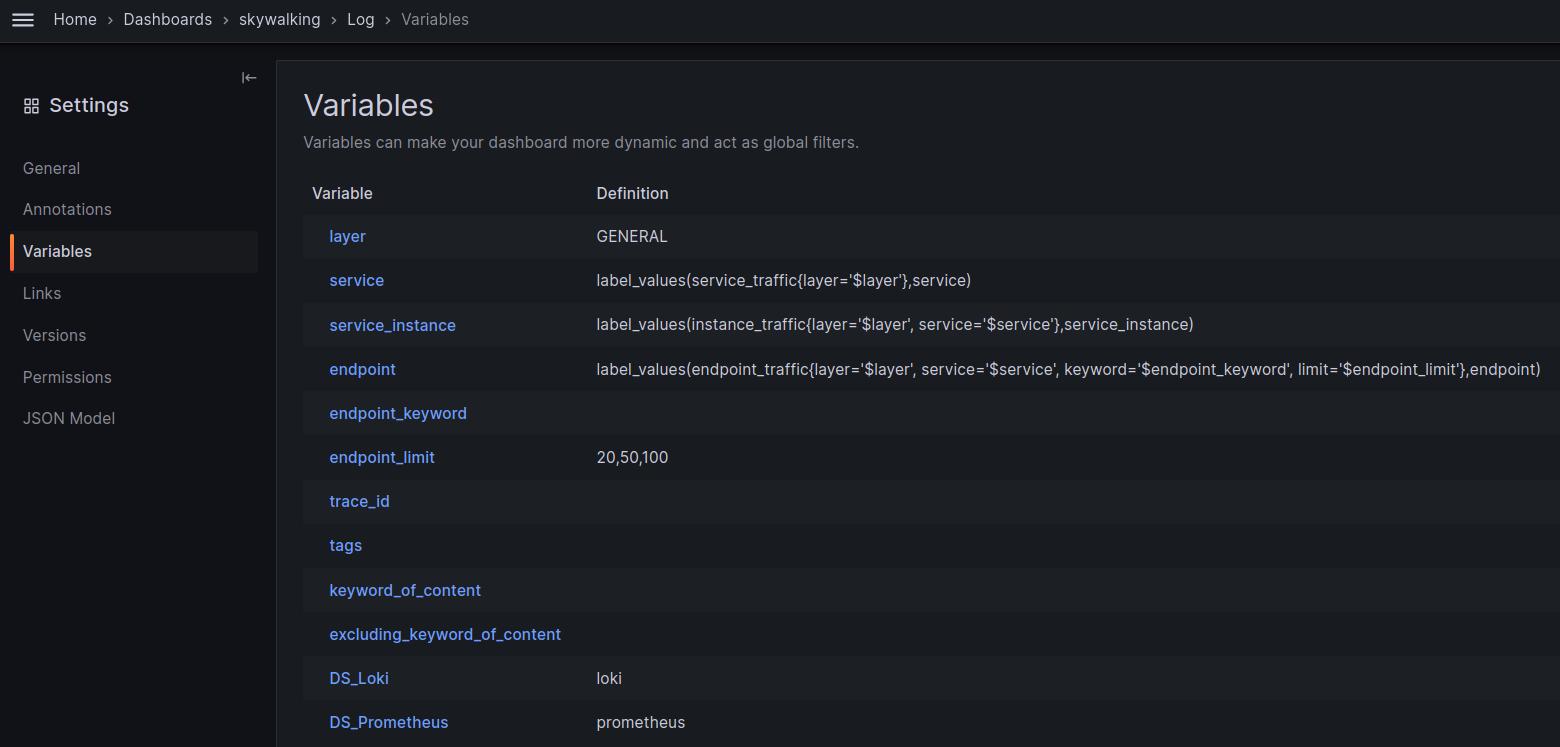
- Please make sure
service_instanceandendpointvariable enabledInclude Alloption and setCustom all valueto * or blank (typed by space button on the keyboard):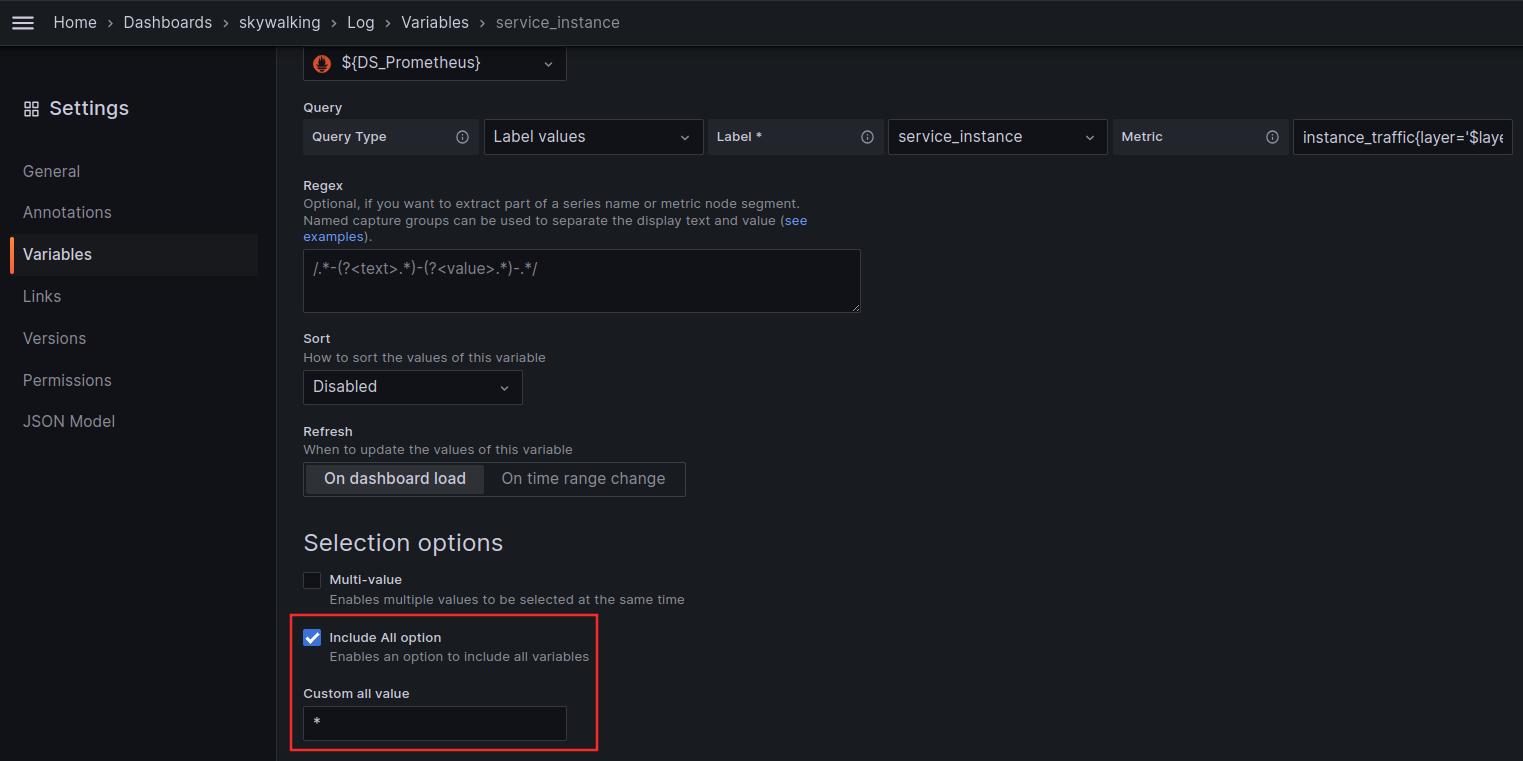
Tagsvariable is a little different from others, for more details, please refer Ad hoc filters: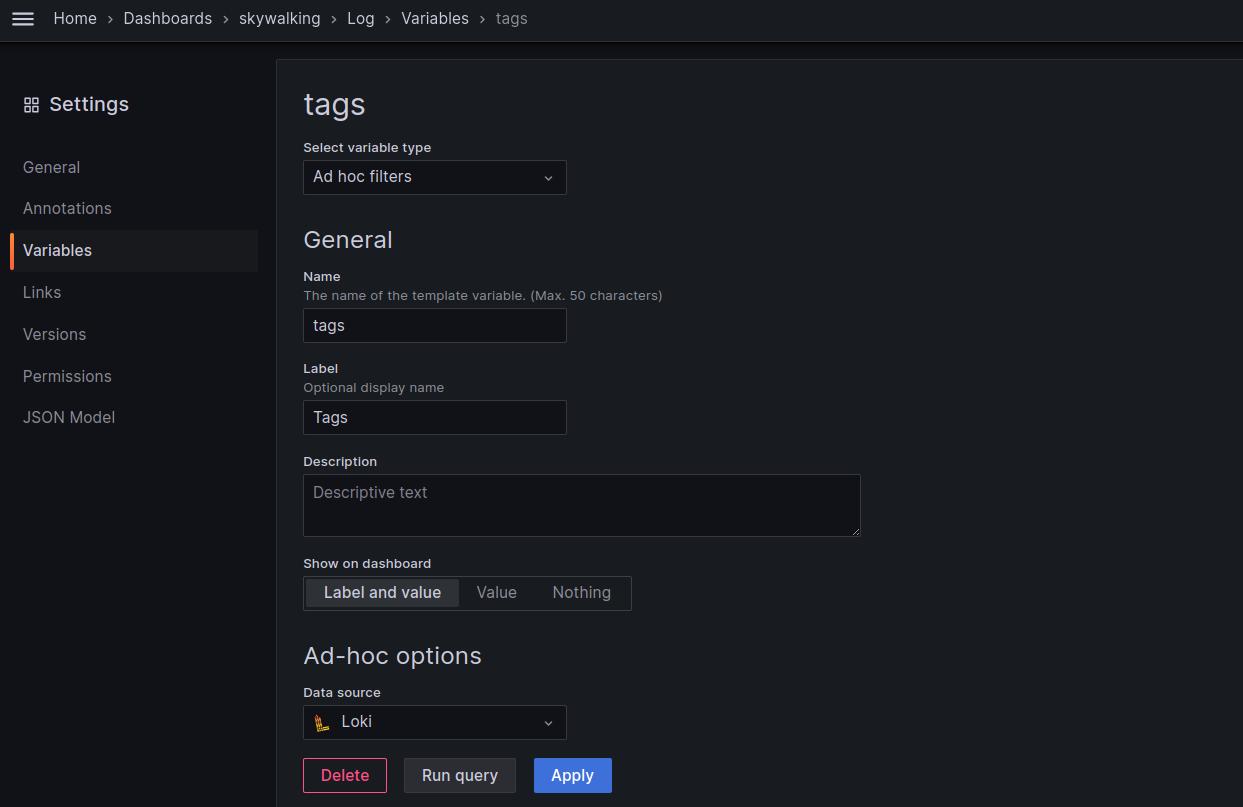
- After configure, you can select log query variables on the top of the dashboard:

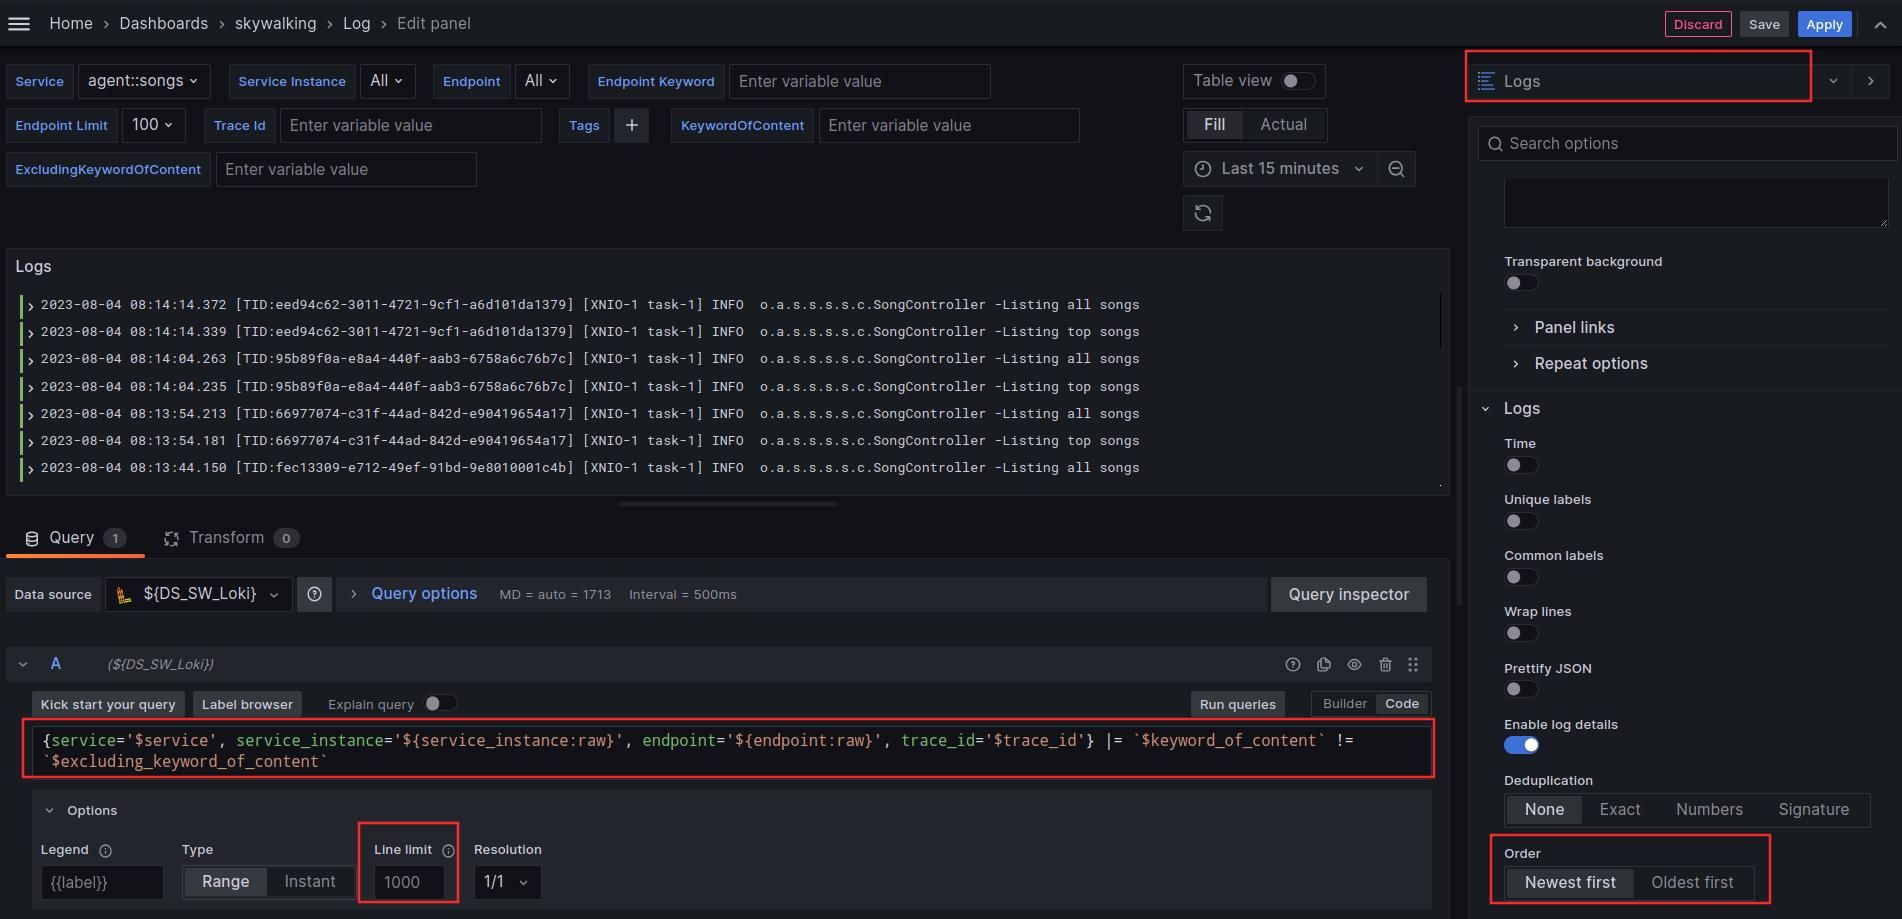
Add Log Panel
The following steps show how to add a log panel.
- Choose
Logschart. - Set the
Line limitvalue (The max number of logs to return in a query) andOrdervalue (Determines the sort order of logs). - Add LogQL expressions, use the variables configured above for the labels and searching keyword.
service_instance&endpointvariable ref should use raw variable-format-options to prevent it value be escaped. - Test query and save the panel.
Configure Relation Dashboards
Dashboards Settings
The following steps are the example of config a General Relation dashboard:
- Create a dashboard named
General Relation. - Configure variables for the dashboard:
 After configure, you can select the service/instance/endpoint and the dest service/instance/endpoint on the top of the dashboard:

Add Relation Metrics Panel
The following contents show how to add relation metric panels.
- Chose the metrics and chart.
- Set
Query options,Connect null values,Show pointsandReturned Labels. Please referConfigure Metric Dashboardspart. - Add PromQL expression, For all scopes, set
Layer,Dest Layer,ServiceandDest Serviceby the variables. For service instance relation scope, extra setService InstanceandDest Service Instance. For endpoint relation scope, extra setEndpointandDest Endpoint. - Test query and save the panel.

Configure Trace Dashboard
SkyWalking Native Trace
Dashboards Settings
The following steps are an example of configuring a Trace dashboard for SkyWalking native trace:
- Go to the
Explorepage, select theTempodata source namedSkyWalkingTraceQL(the name you configured). Add it to the dashboard and save it asSkyWalking Trace.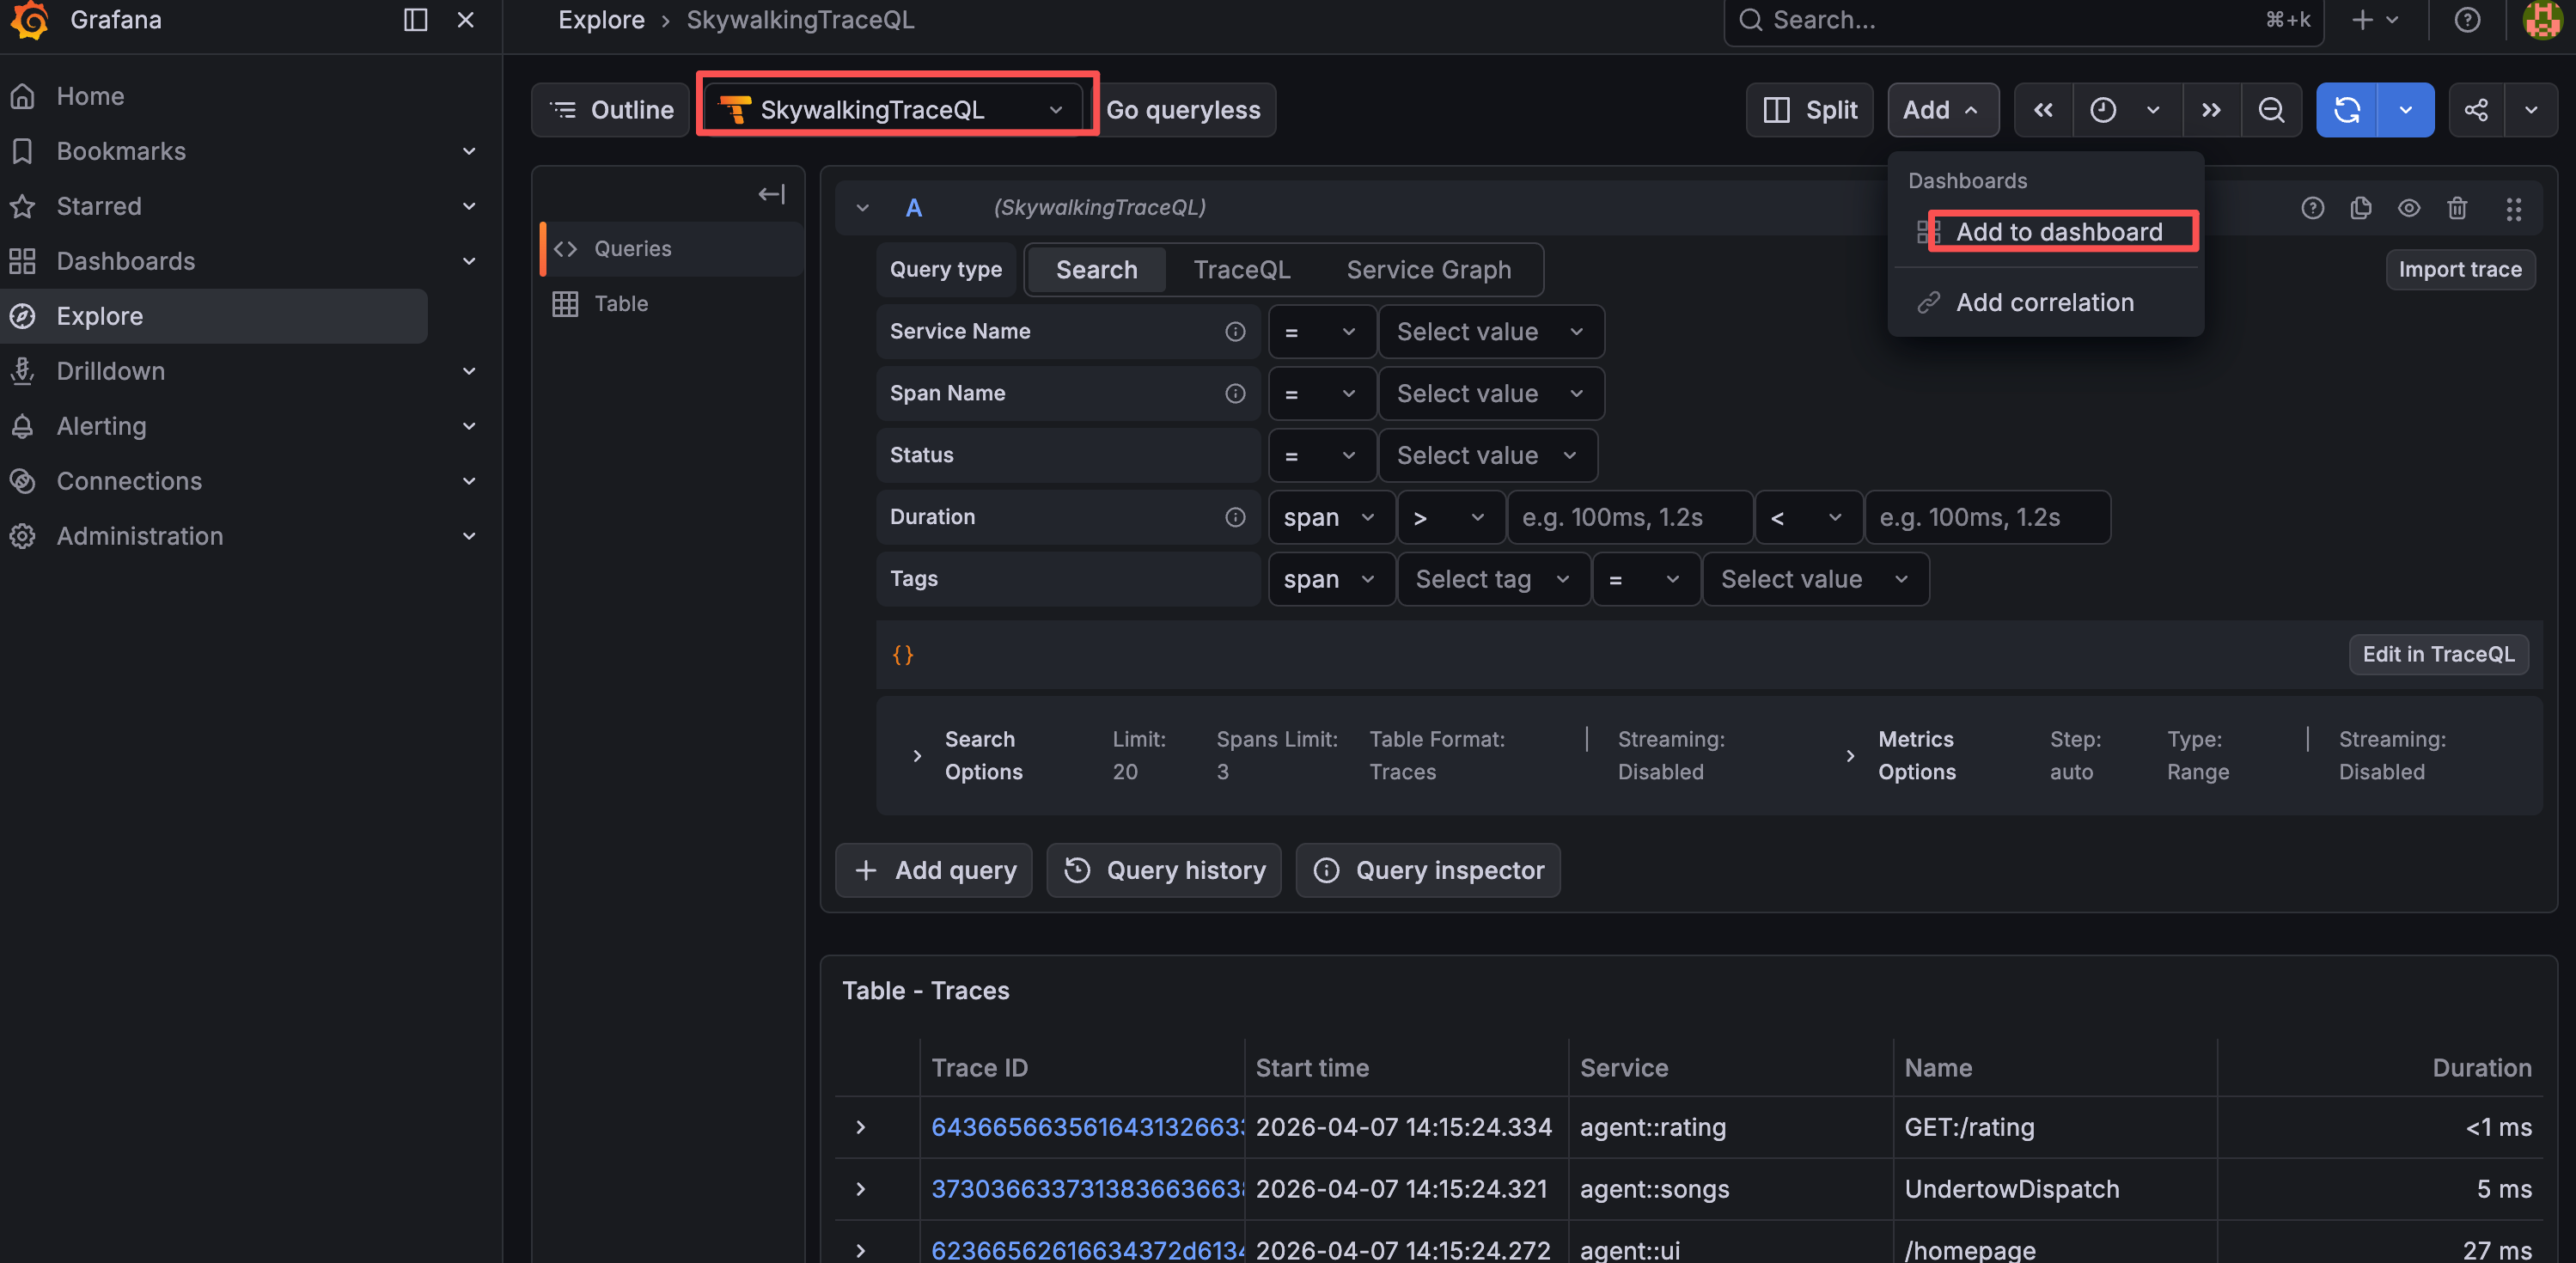
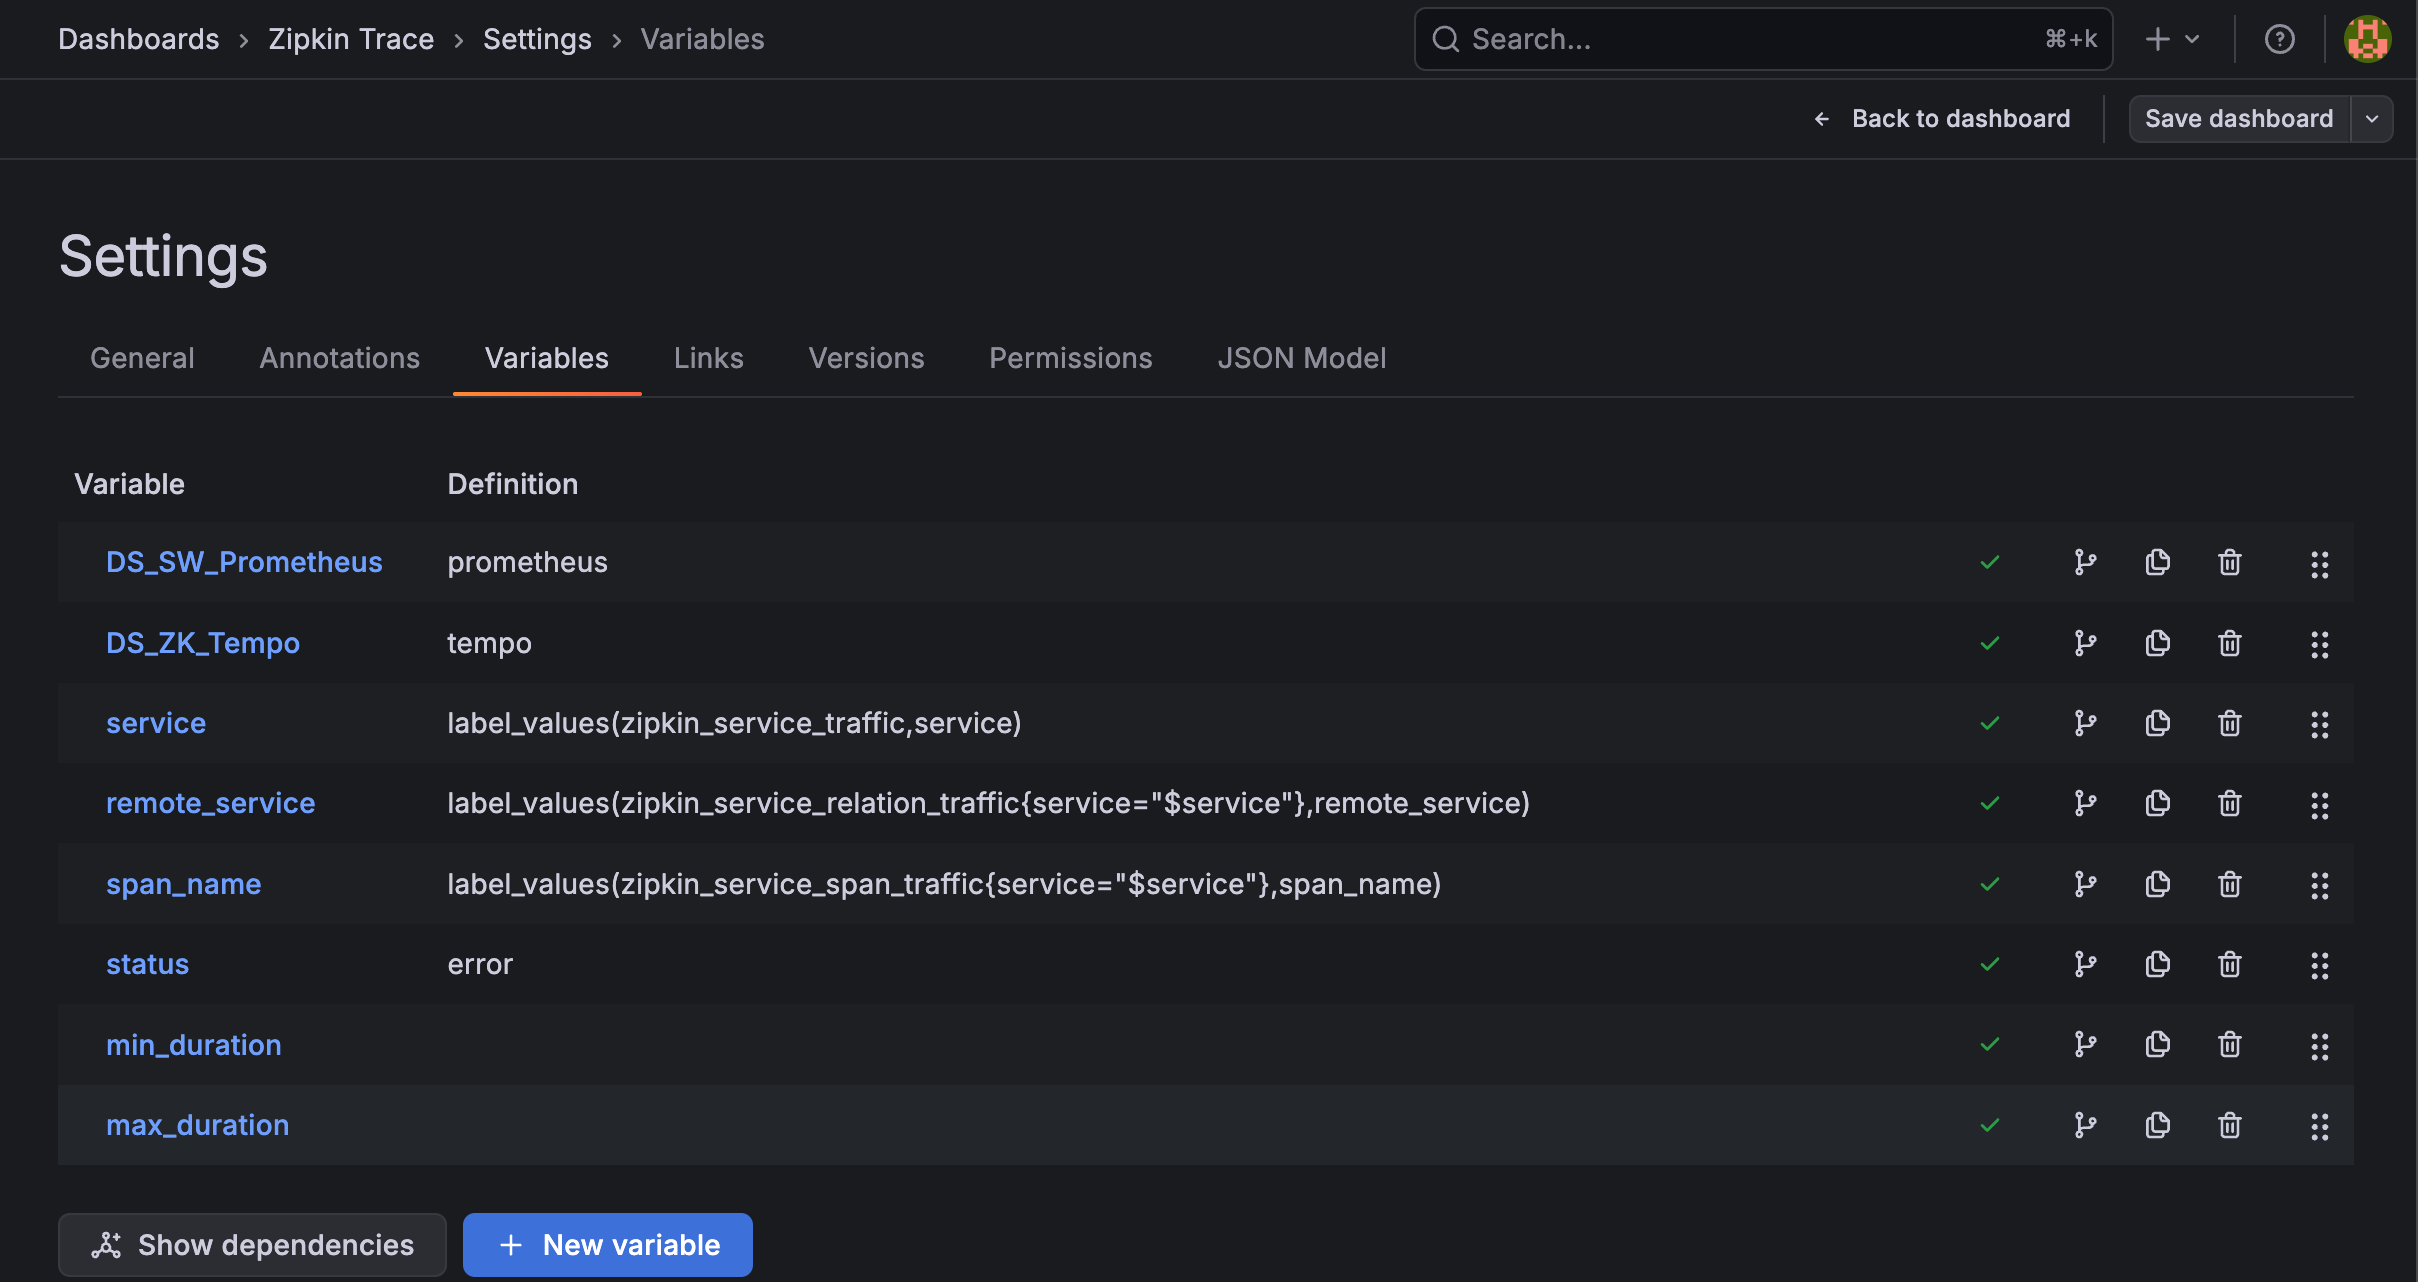
- Configure variables for the dashboard:
Notice: The variables (Service/Instance/Endpoint) querying leverage the Prometheus data source
SkyWalkingPromQL(DS_SW_Prometheus).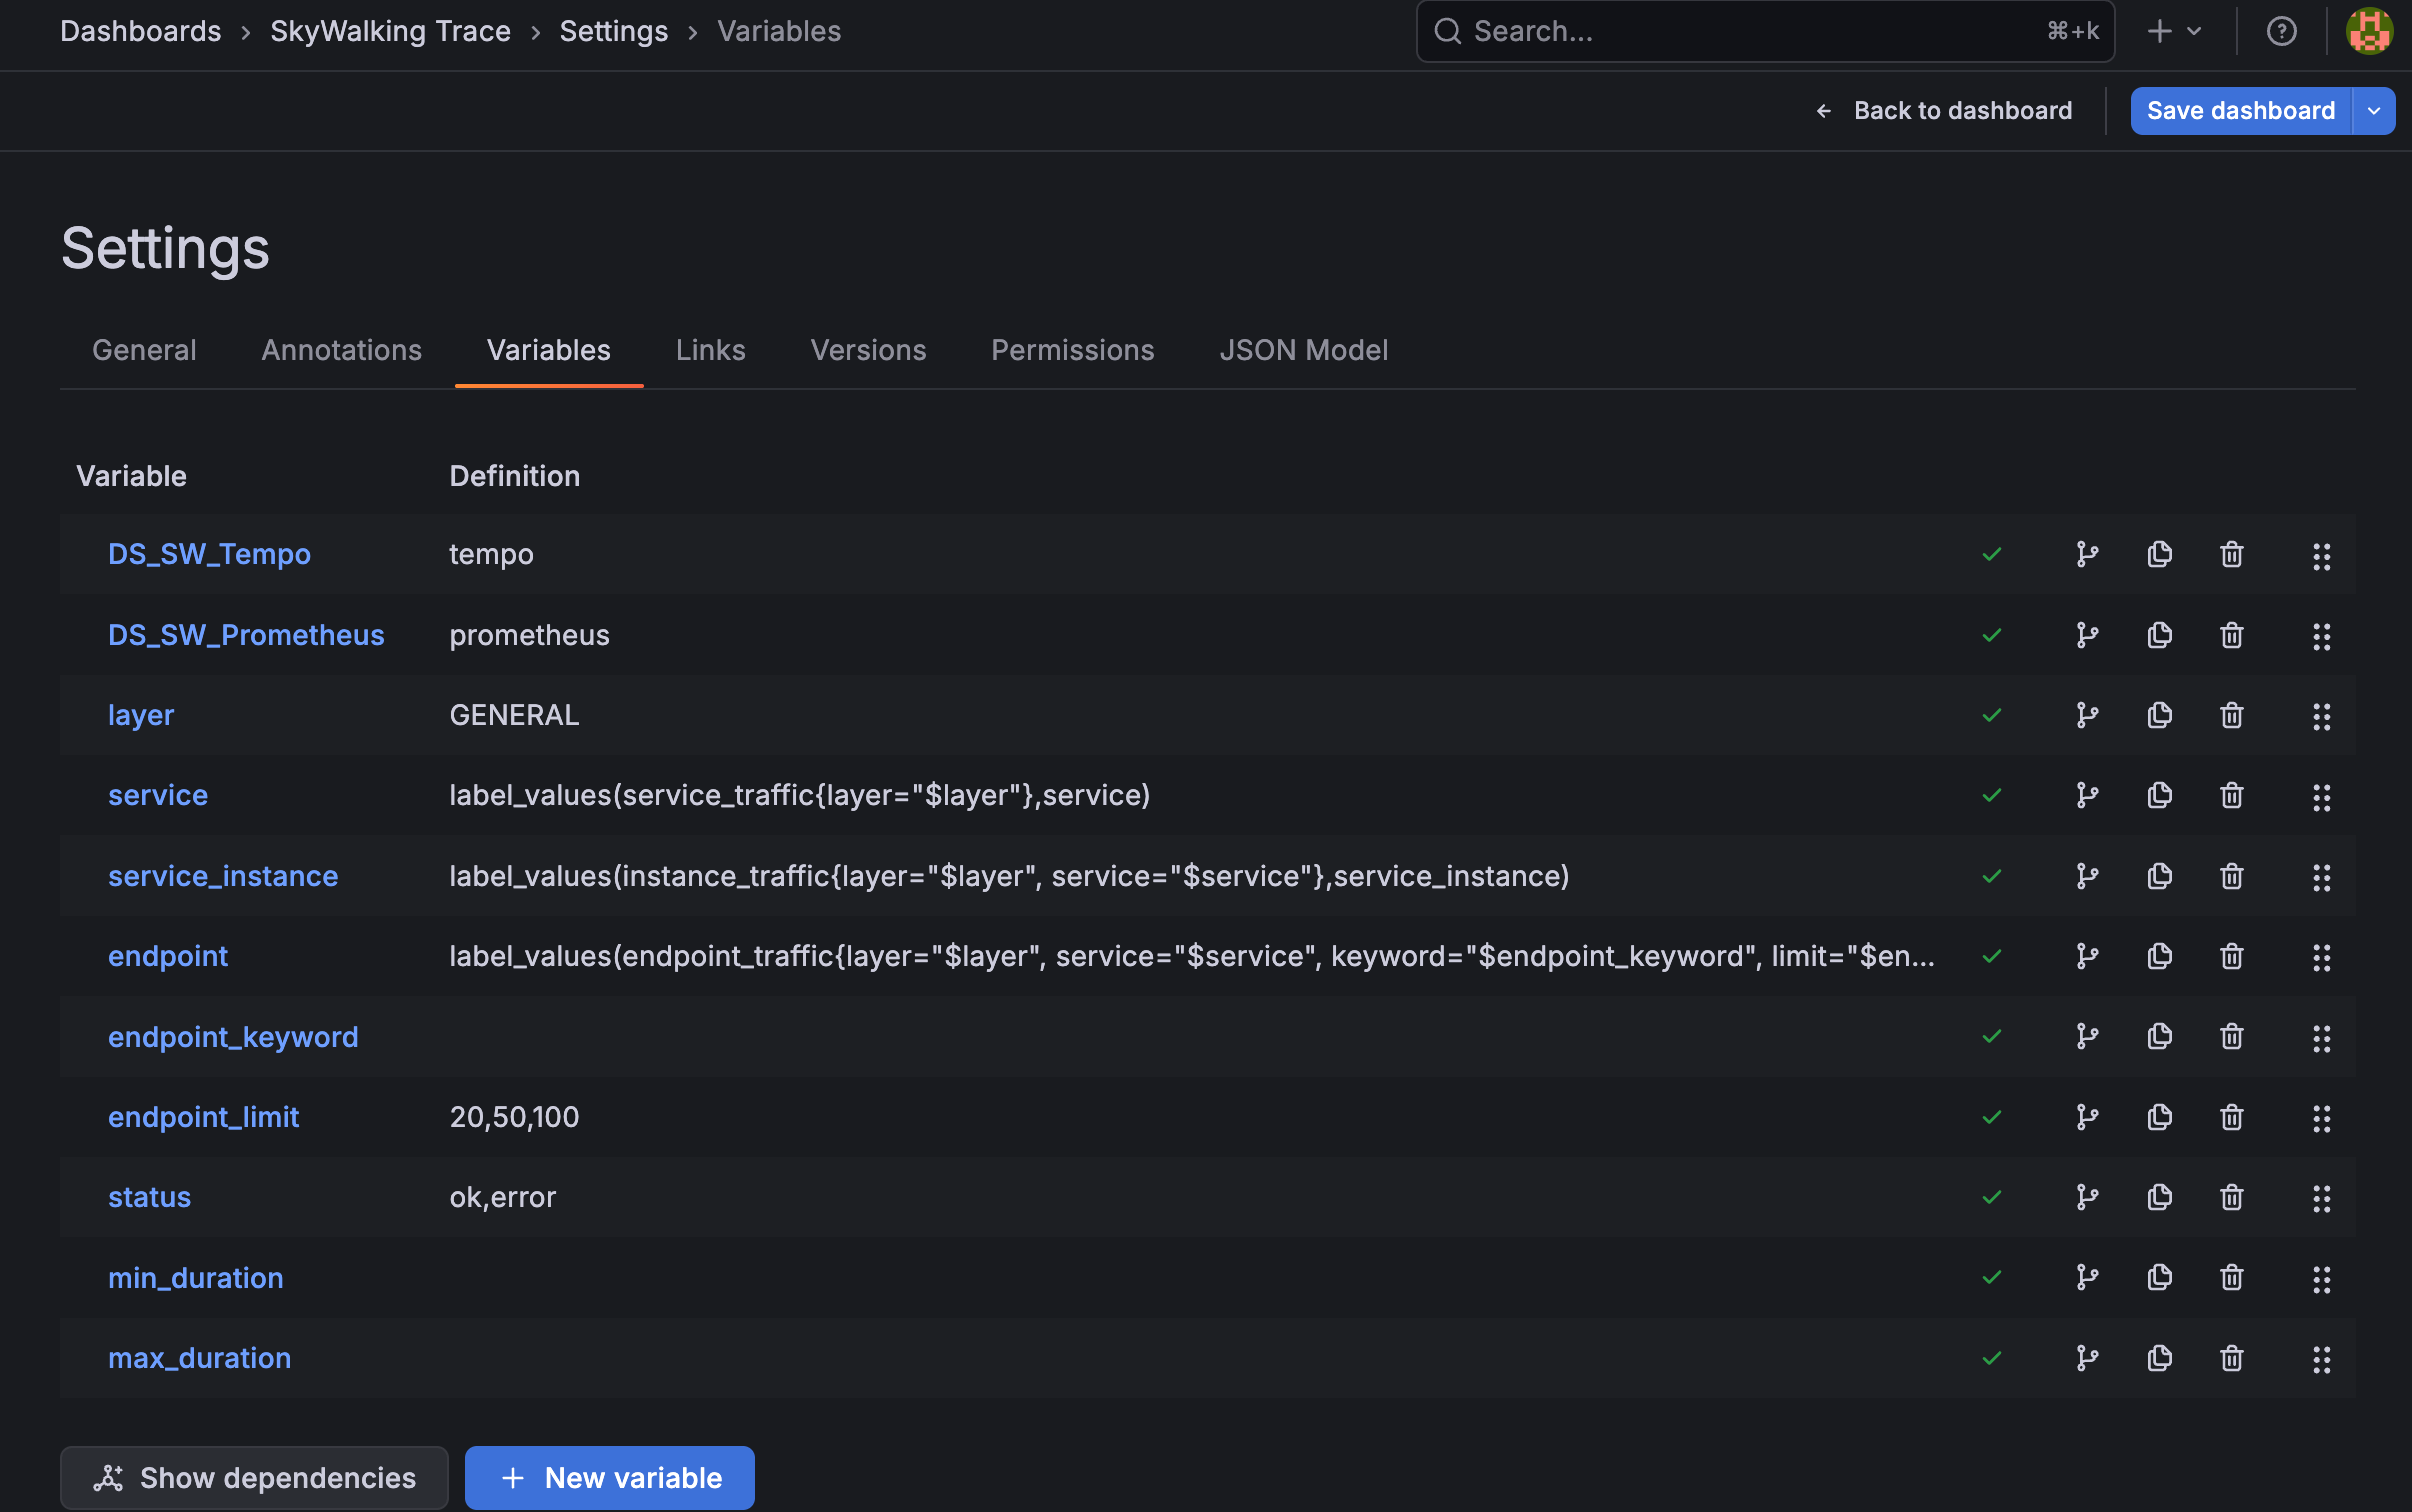
- If you want the Service/Instance/Endpoint variables to support the
Alloption, enableAllow custom valuesand setCustom all valueto*so it matches the backend wildcard.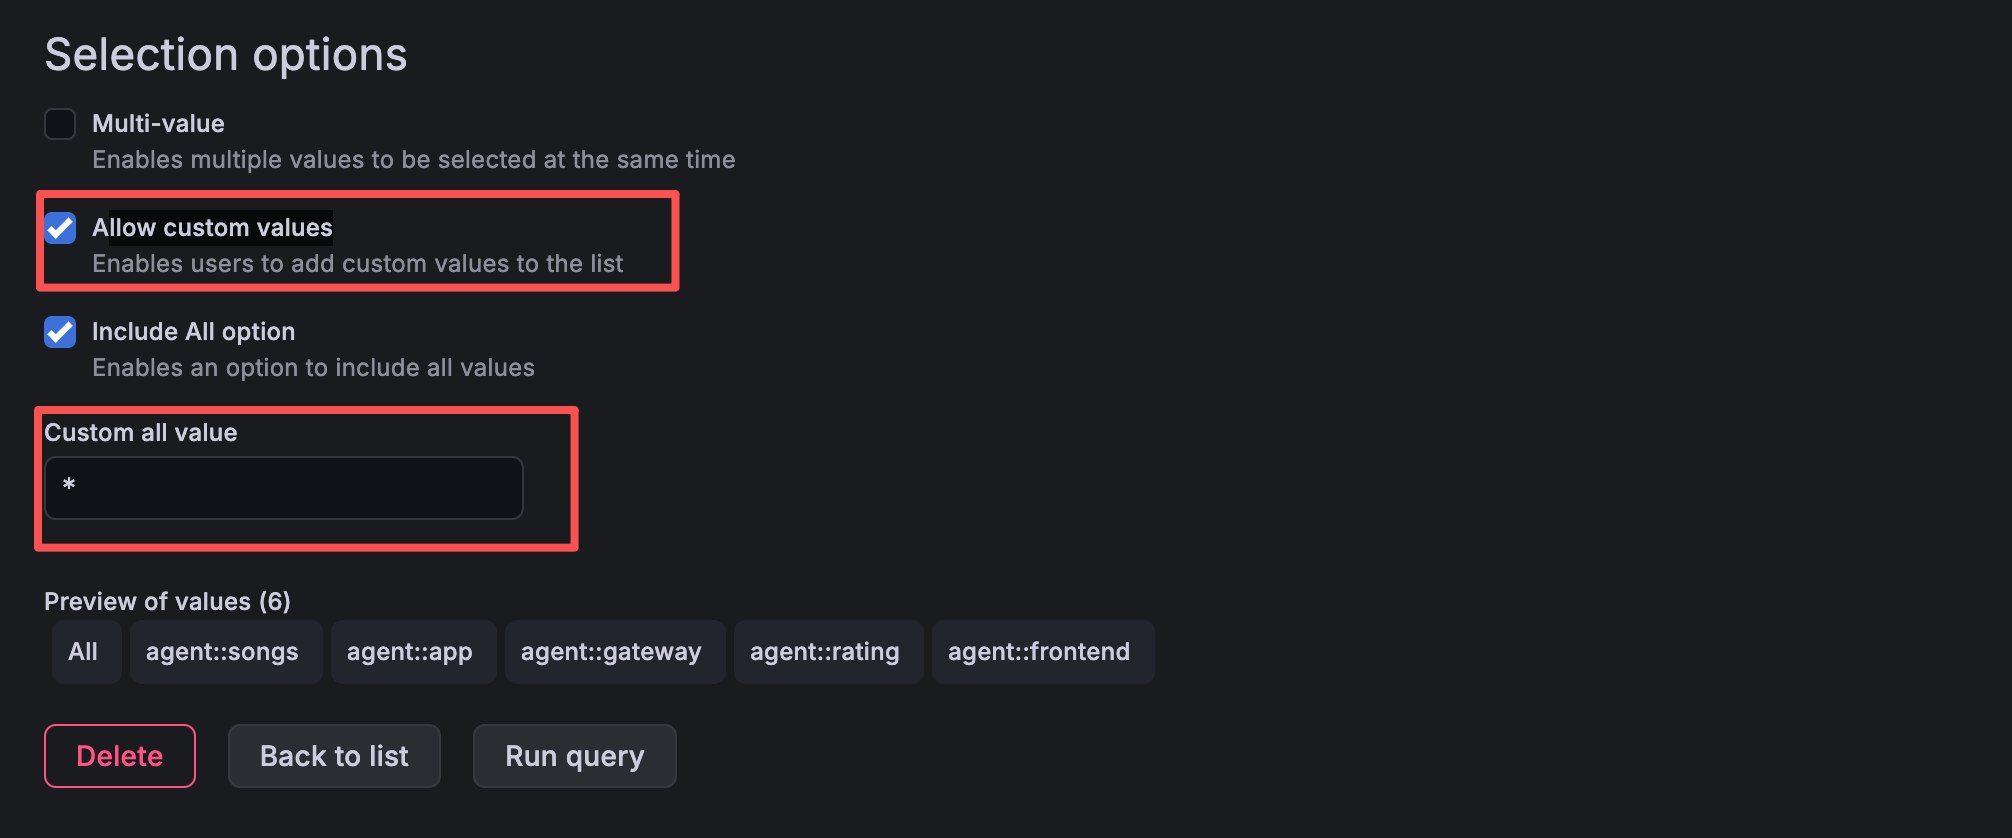
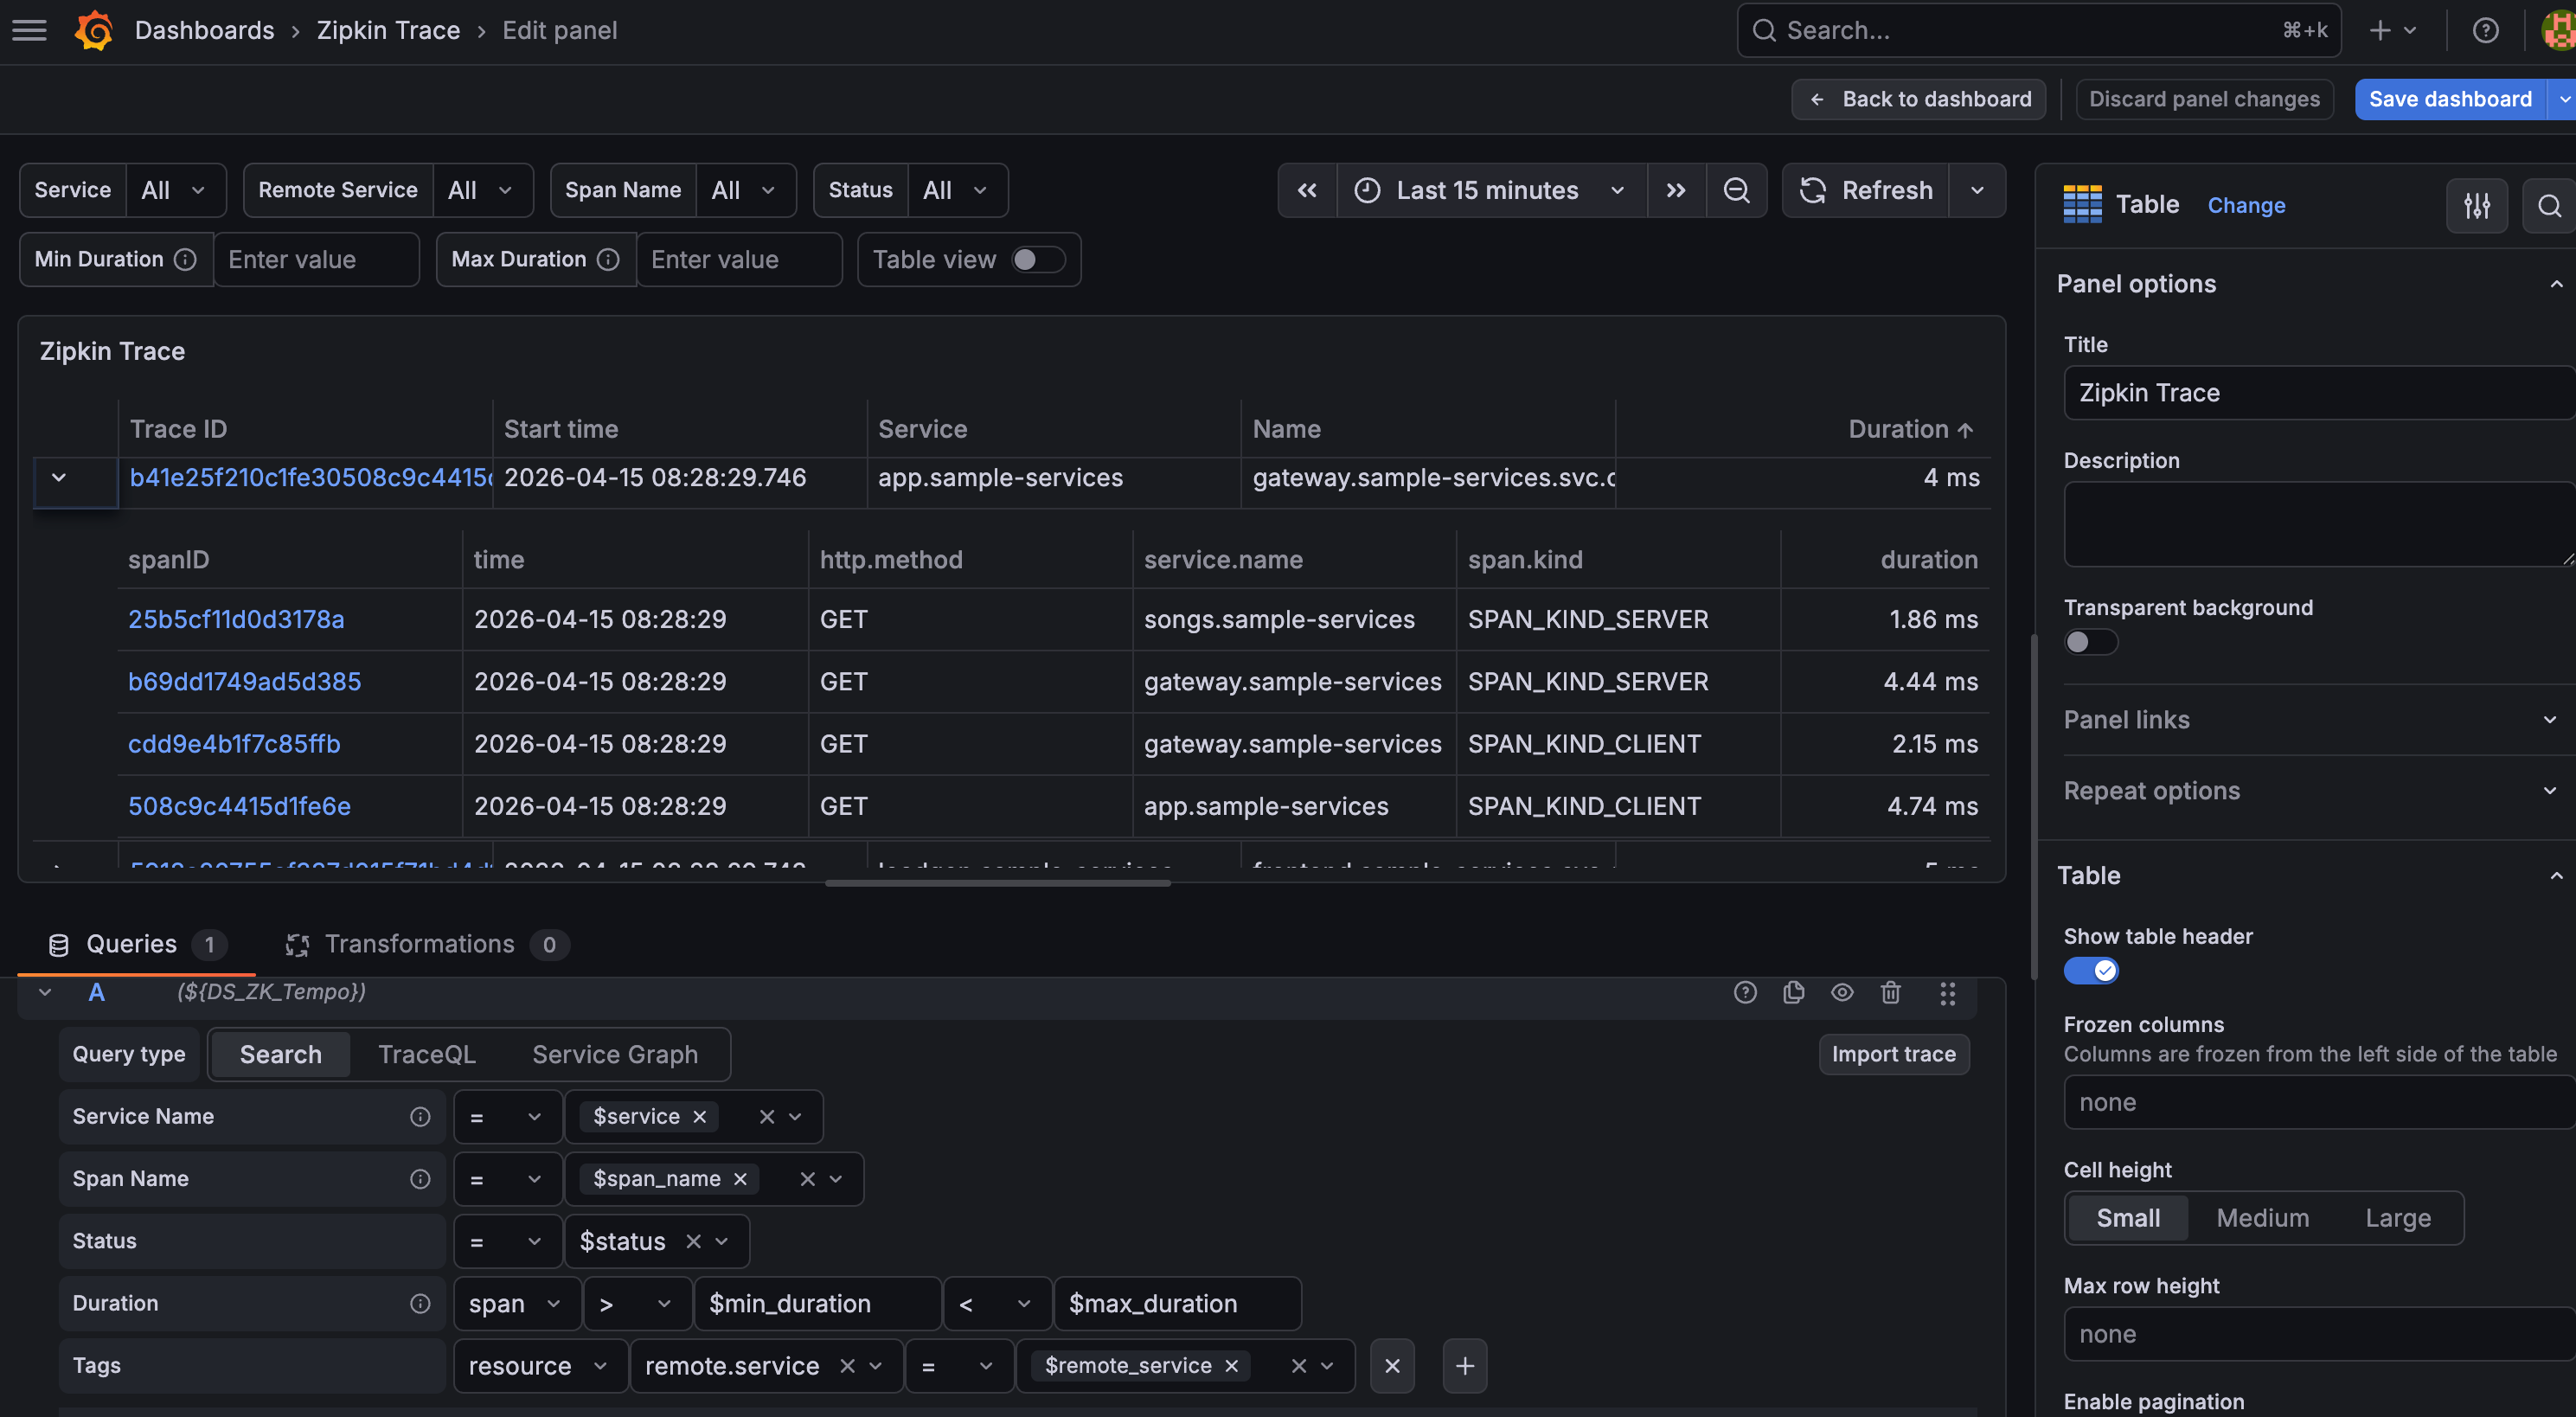
Add Trace Panel
The following steps show how to add a trace panel for SkyWalking native trace.
- Choose
Tablechart or edit your saved panel. - Set
Query typetoSearchand set the query condition to variables, such asService Nameto$Service. - Set other query conditions if needed.
- Test query and save the panel.
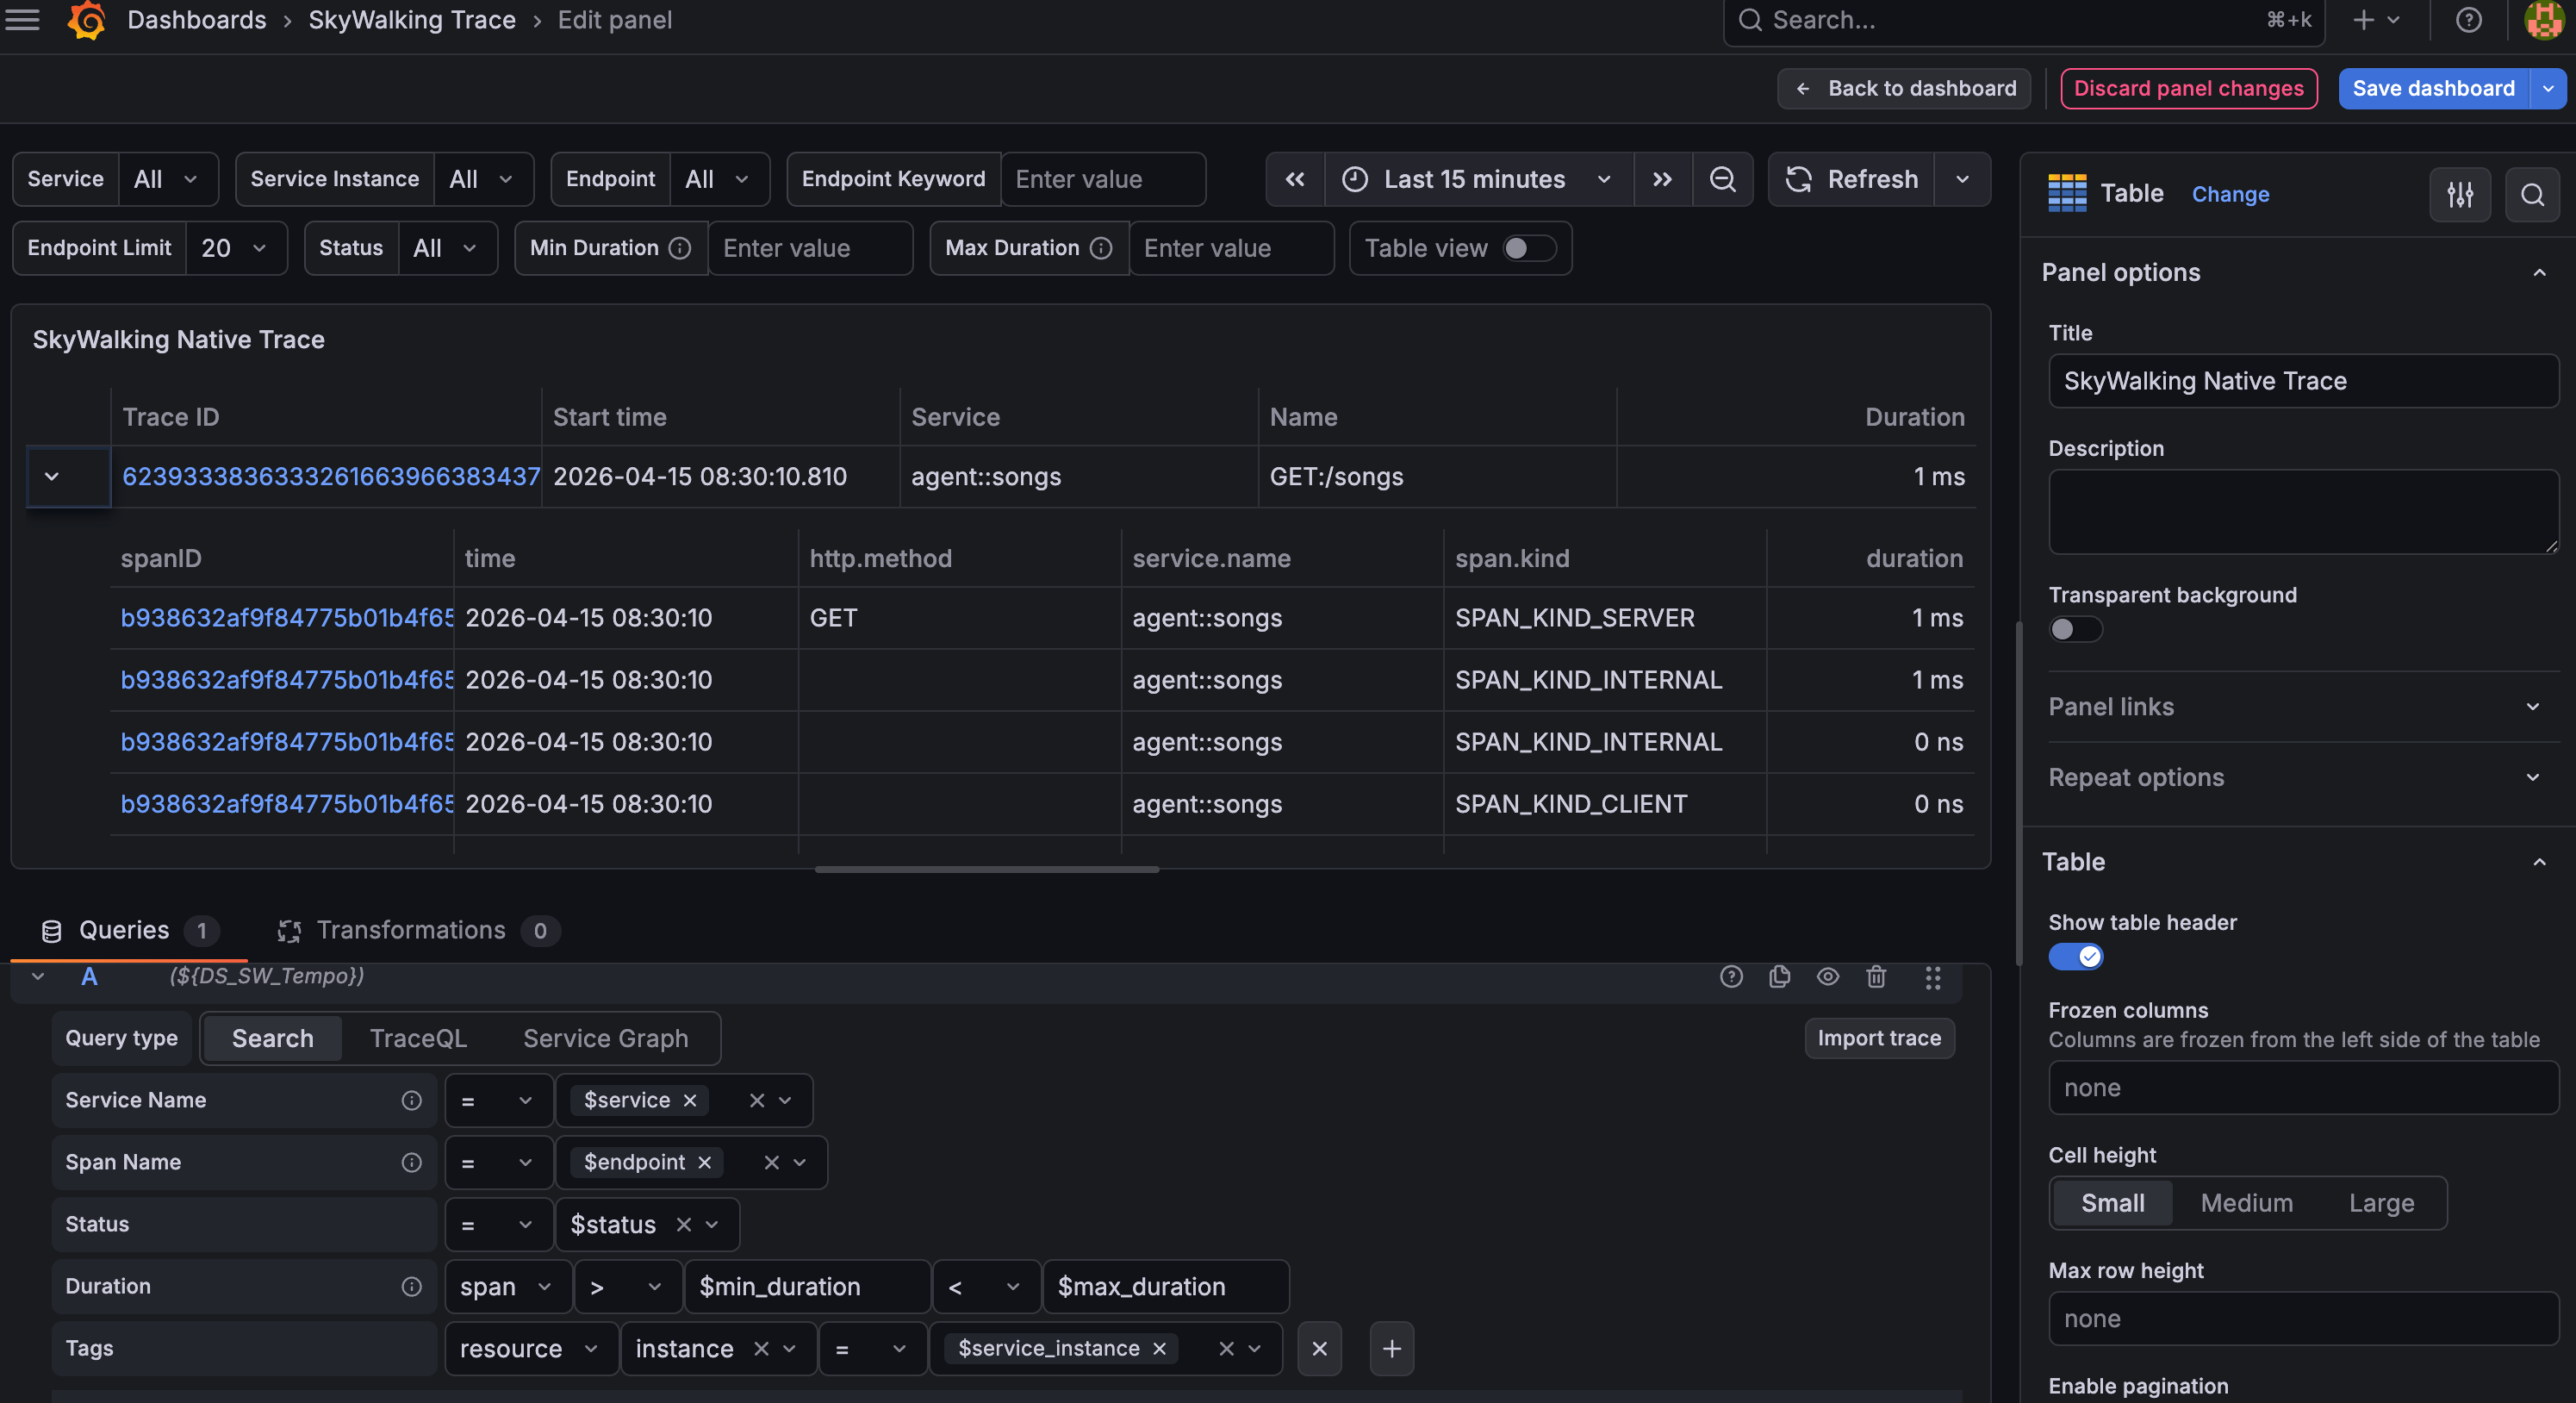
- If you click the trace ID on the trace panel, it will jump to the explore page and show the trace details.
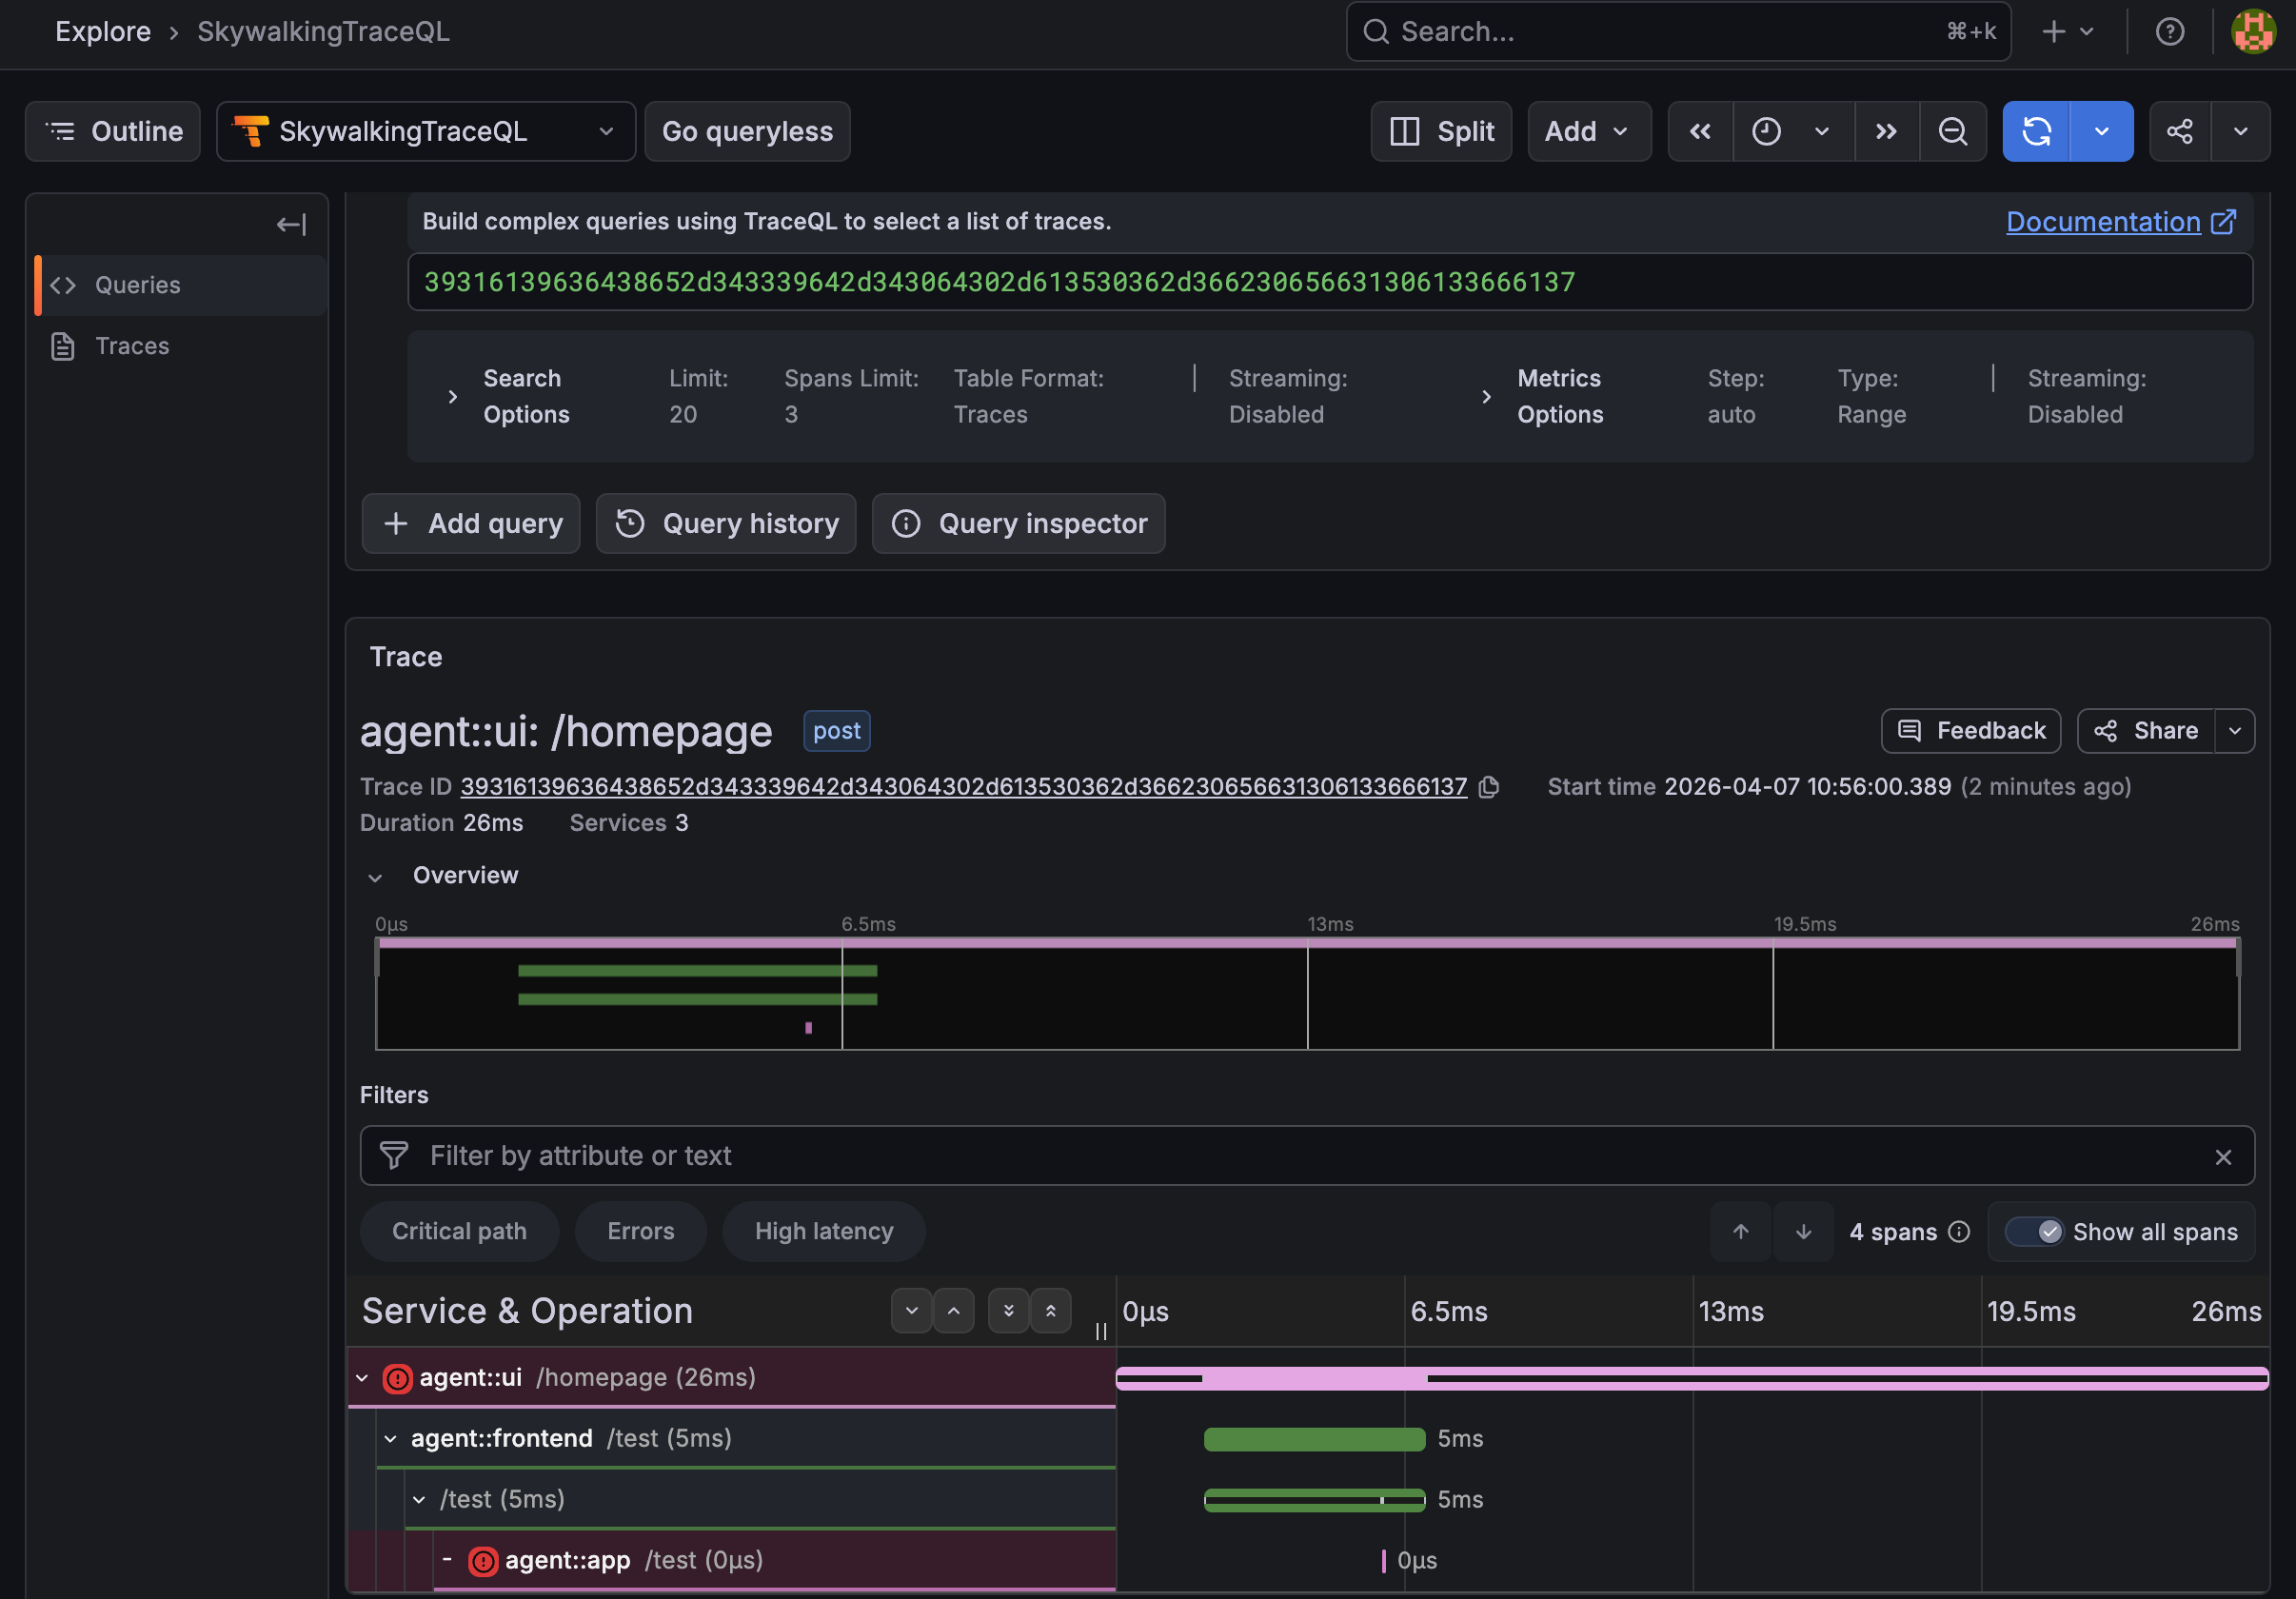
Zipkin Trace
Same as the SkyWalking native trace, but use the Zipkin Tempo data source you configured.
The following are the variables and trace panel configuration screenshots for Zipkin trace:
Preview on demo.skywalking.a.o
SkyWalking community provides a preview site for services of General and Service Mesh layers from the demo environment.
You could take a glance through Preview metrics on Grafana of the demo deployment.
Notice, we don’t provide all setups due to our monitoring target expanding fast. This demo is for helping you understand the above documents only.