Overview
SkyWalking is an open source observability platform used to collect, analyze, aggregate and visualize data from services and cloud native infrastructures. SkyWalking provides an easy way to maintain a clear view of your distributed systems, even across Clouds. It is a modern APM, specially designed for cloud native, container based distributed systems.
SkyWalking covers all the observability needs in Cloud Native world, including:
- Tracing. SkyWalking native data formats, and Zipkin traces of v1 and v2 formats are supported.
- Metrics. SkyWalking supports mature metrics formats, including native meter format, OTEL metrics format, and Telegraf format. SkyWalking integrates with Service Mesh platforms, typically Istio and Envoy, to build observability into the data plane or control plane. Also, SkyWalking native agents can run in the metrics mode, which greatly improves performances.
- Logging. Includes logs collected from disk or through network. Native agents could bind the tracing context with logs automatically, or use SkyWalking to bind the trace and log through the text content.
- Profiling. Profiling is a powerful tool to help developers understand the performance of their applications from lines of codes perspective. SkyWalking provides profiling feature bundled in native language agents and independent ebpf agents.
- Event. Event is a special kind of data, which is used to record the important moments in the system, such as version upgrade, configuration change, etc. Linking the events with metrics could help on explain the peaks or valleys in the metrics, and linking the events with traces and logs could help on troubleshooting root cause.
Why use SkyWalking?
SkyWalking provides solutions for observing and monitoring distributed systems, in many different scenarios. First of all, like traditional approaches, SkyWalking provides auto instrument agents for services, such as Java, C#, Node.js, Go, PHP and Python, and manually SDKs for C++, Rust, and Nginx LUA. In multi-language, continuously deployed environments, cloud native infrastructures grow more powerful but also more complex. SkyWalking’s service mesh receiver allows SkyWalking to receive telemetry data from service mesh frameworks such as Istio/Envoy, allowing users to understand the entire distributed system. Powered by eBPF stack, SkyWalking provides k8s monitoring. Also, by adopting OpenTelemetry, Telegraf, Zabbix, Zipkin, Prometheus, SkyWalking can integrate with other distributed tracing, metrics and logging systems and build a unified APM system to host all data.
Besides the support of various kinds of telemetry formats, the hierarchy structure of objects in SkyWalking is defined as service(s), service instance(s), endpoint(s), process(s). The terms Service, Instance and Endpoint are used everywhere today, so it is worth defining their specific meanings in the context of SkyWalking:
- Layer. A layer represents an abstract framework in computer science, such as Operating System(OS_LINUX layer), and Kubernetes(k8s layer). A layer is an abstract collection of services. A service typically only belongs to one layer, but in some scenarios, a service could belong to multiple layers. For example, a service could be deployed in an Istio service mesh, it could belong to mesh and mesh-dp(mesh data plane) layer.
- Service. Represents a set/group of workloads which provide the same behaviours for incoming requests. You can define the service name when you are using instrument agents or SDKs. SkyWalking can also use the name you define in platforms such as Istio.
- Service Instance. Each individual workload in the Service group is known as an instance. Like
podsin Kubernetes, it doesn’t need to be a single OS process, however, if you are using instrument agents, an instance is actually a real OS process. - Endpoint. A path in a service for incoming requests, such as an HTTP URI path or a gRPC service class + method signature.
- Process. An operating system process. In some scenarios, a Service Instance is not a process, such as a pod Kubernetes could contain multiple processes.
SkyWalking allows users to understand the topology relationship between Services and Endpoints, also detect API dependencies in the distributed environment if you use our native agents.,
Besides topology map, SkyWalking provides Service Hierarchy Relationship , which defines the relationships of existing logically same services in various layers. For example, a service could be deployed in a Kubernetes cluster with Istio mesh, services are detected by k8s monitoring and Istio mesh, this hierarchy relationship could connect the services in k8s layer and mesh layer.
Architecture
SkyWalking is logically split into four parts: Probes, Platform backend, Storage and UI.
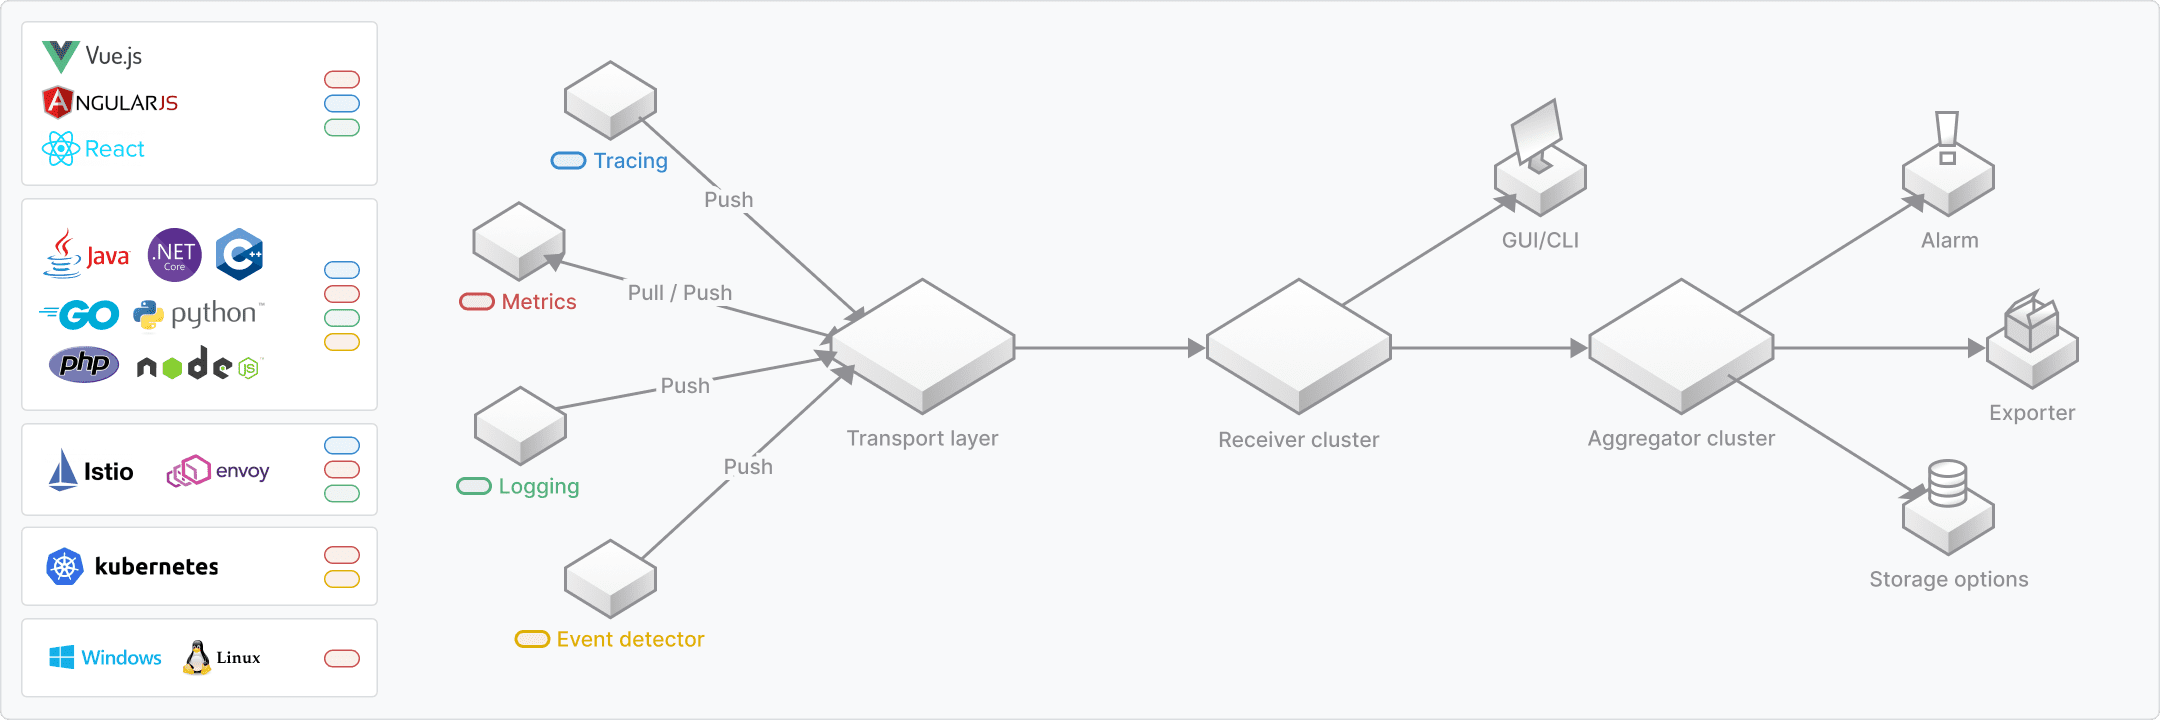
- Probes collect telemetry data, including metrics, traces, logs and events in various formats(SkyWalking, Zipkin, OpenTelemetry, Prometheus, Zabbix, etc.)
- Platform backend supports data aggregation, analysis and streaming process covers traces, metrics, logs and events. Work as Aggregator Role, Receiver Role or both.
- Storage houses SkyWalking data through an open/plugable interface. You can choose an existing implementation, such as ElasticSearch, H2, MySQL, TiDB, BanyanDB, or implement your own.
- UI is a highly customizable web based interface allowing SkyWalking end users to visualize and manage SkyWalking data.
What is next?
- Learn SkyWalking’s Project Goals
- FAQ, Why doesn’t SkyWalking involve MQ in the architecture in default?