Observability
This document outlines the observability features of BanyanDB, which include metrics, profiling, and tracing. These features help monitor and understand the performance, behavior, and overall health of BanyanDB.
Metrics
BanyanDB has built-in support for metrics collection. Currently, there are two supported metrics provider: prometheus and native. These can be enabled through observability-modes flag, allowing you to activate one or both of them.
Prometheus
Prometheus is auto enabled at run time, if no flag is passed or if promethus is set in observability-modes flag.
When the Prometheus metrics provider is enabled, the metrics server listens on port 2121. This allows Prometheus to scrape metrics data from BanyanDB for monitoring and analysis.
Self-observability
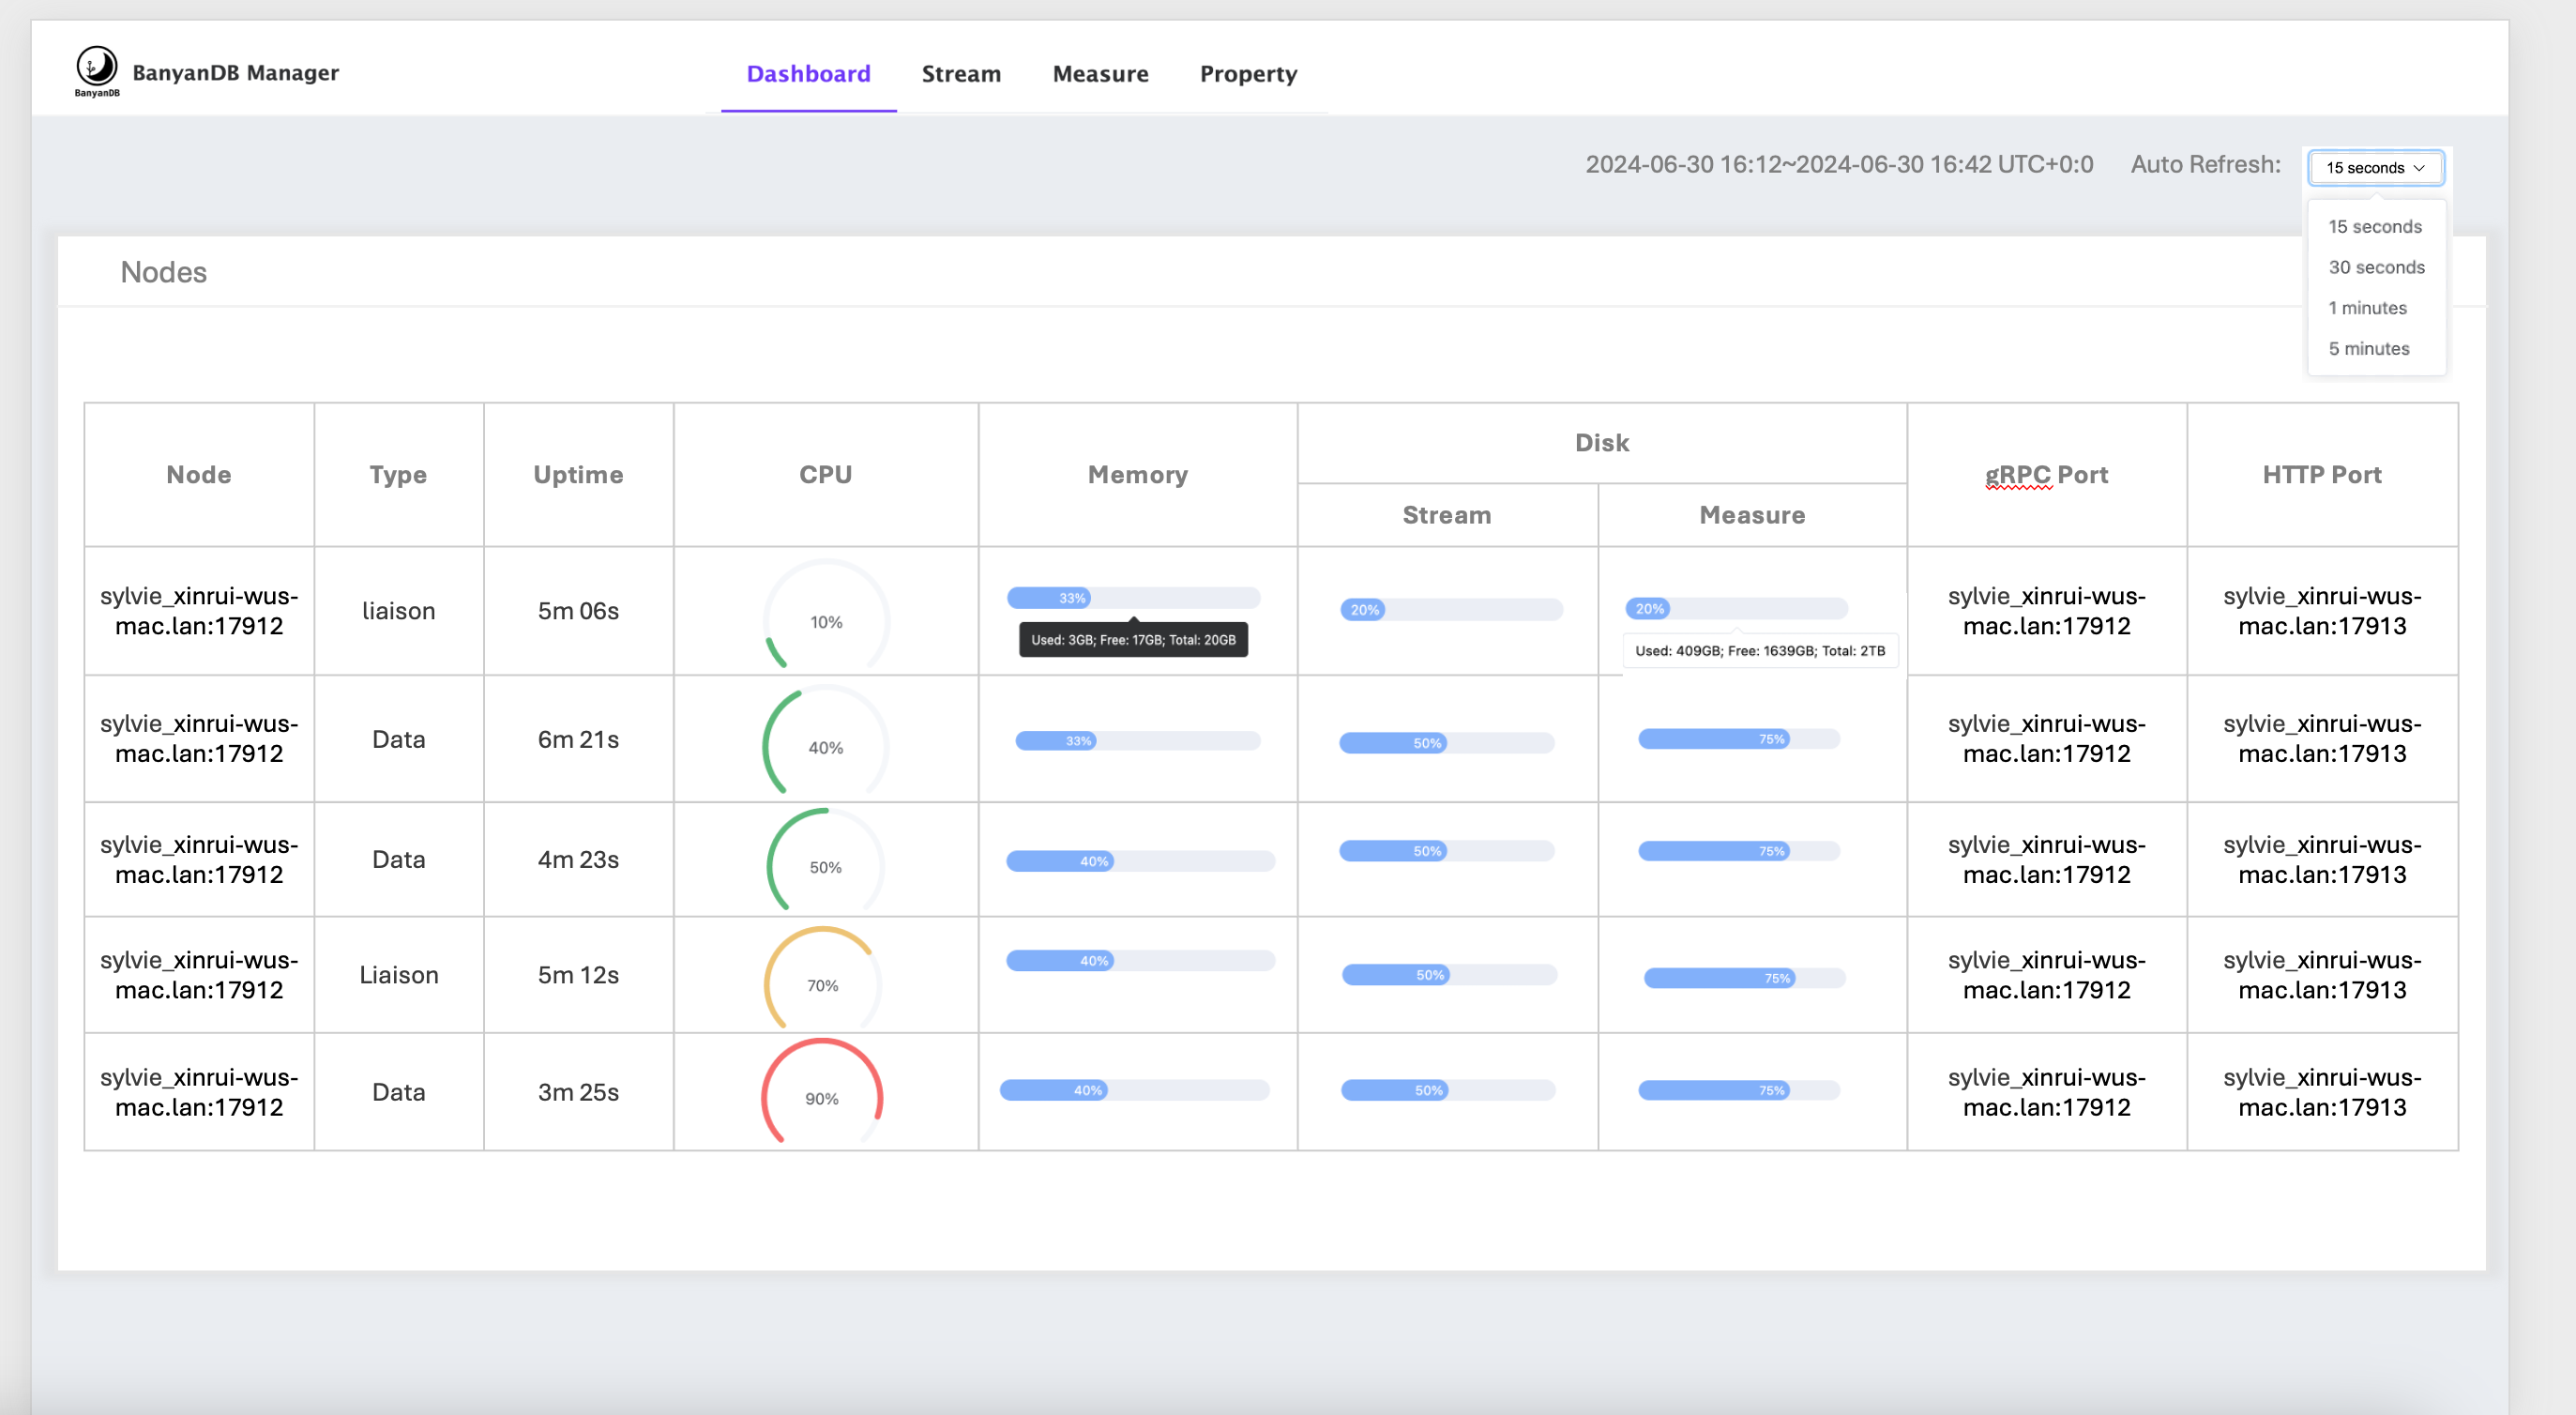
If the observability-modes flag is set to native, the self-observability metrics provider will be enabled. The some of metrics will be displayed in the dashboard of banyandb-ui
Metrics storage
In self-observability, the metrics data is stored in BanyanDB within the _monitoring internal group. Each metric will be created as a new measure within this group.
You can use BanyanDB-UI or bydbctl to retrieve the data.
Write Flow
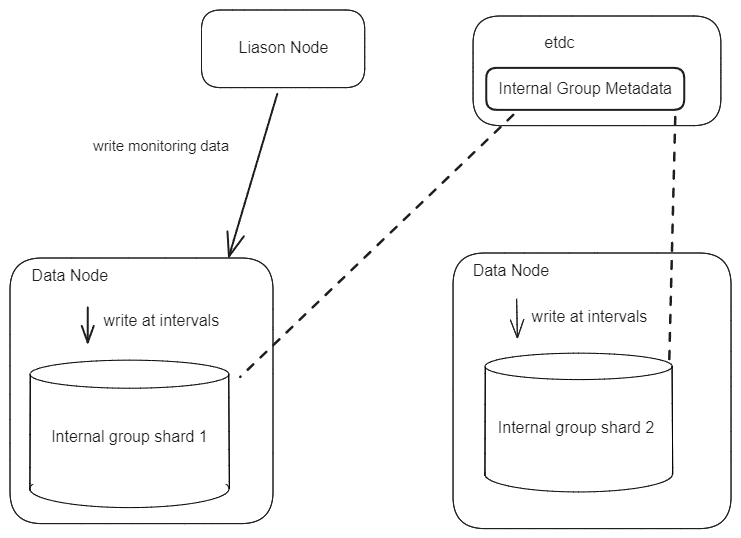
When starting any node, the _monitoring internal group will be created, and the metrics will be created as measures within this group. All metric values will be collected and written together at a configurable fixed interval. For a data node, it will write metric values to its own shard using a local pipeline. For a liaison node, it will use nodeSelector to select a data node to write its metric data.
Read Flow
The read flow is the same as reading data from measure, with each metric being a new measure.
Profiling
Banyand, the server of BanyanDB, supports profiling automatically. The profiling data is collected by the pprof package and can be accessed through the /debug/pprof endpoint. The port of the profiling server is 2122 by default.