Introduction to UI
The SkyWalking official UI provides the default and powerful visualization capabilities for SkyWalking to observe full-stack applications.
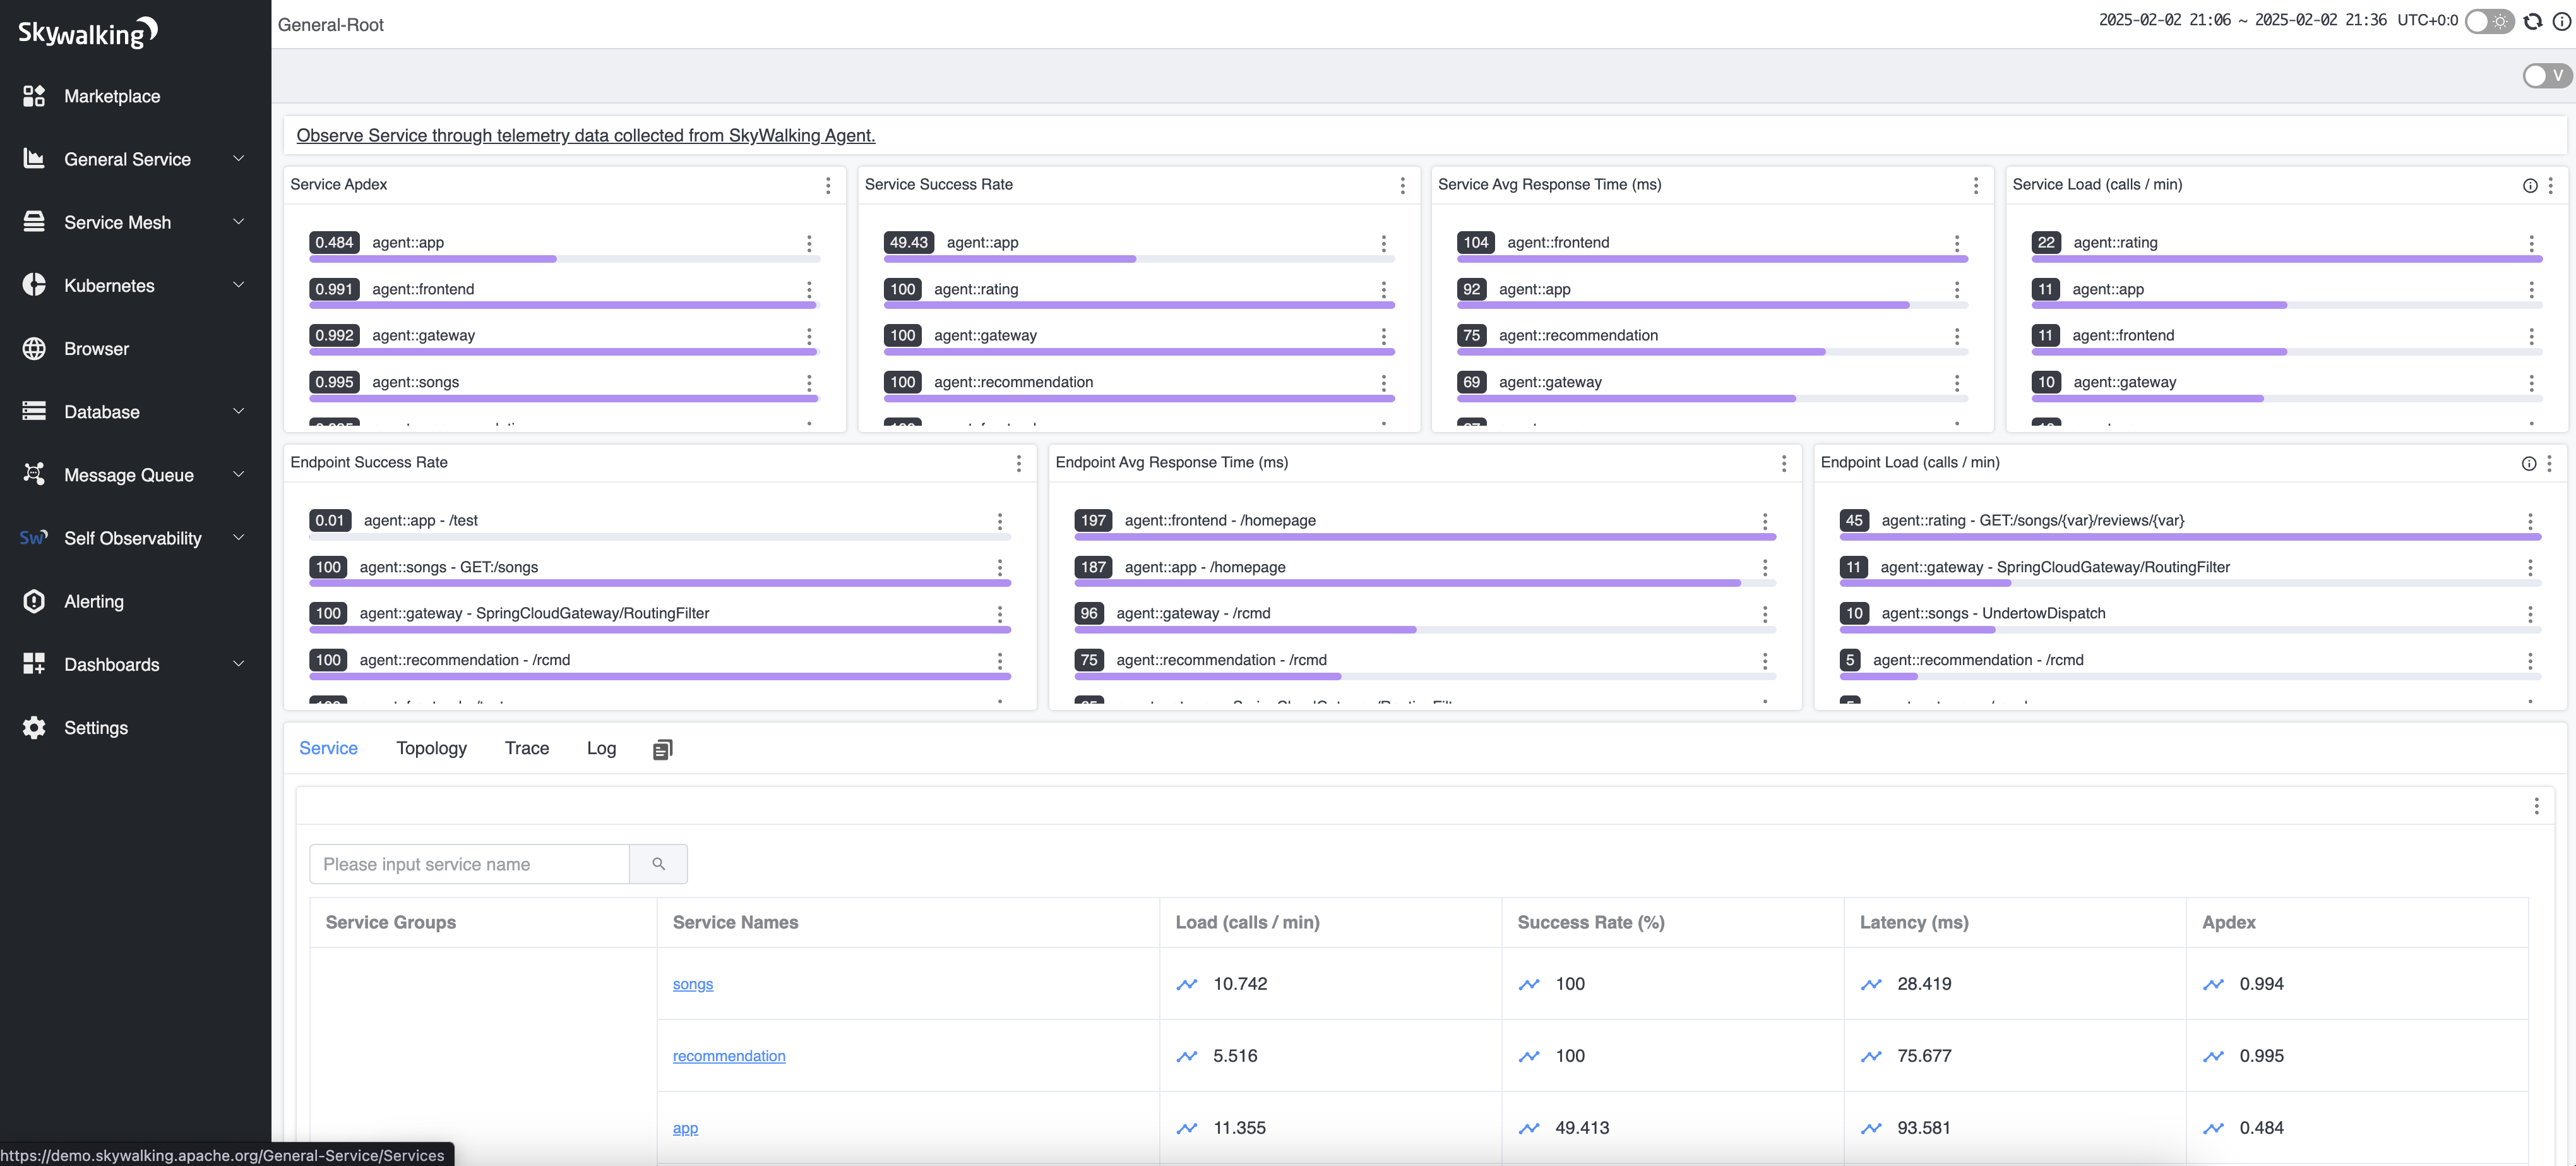
The left side menu lists all available supported stacks with default dashboards.
Follow the Official Dashboards menu to explore all default dashboards on their ways to monitor different tech stacks.
Sidebar Menu and Marketplace
All available feature menu items are only listed in the marketplace(since 9.6.0). They are only visible on the Sidebar Menu when there are relative services being observed by various supported observation agents, such as installed language agents, service mesh platform, OTEL integration.
The menu items defined in ui-initialized-templates/menu.yaml are the universal marketplace for all default-supported integration.
The menu definition supports one and two levels items. The leaf menu item should have the layer for navigation.
menus:
  - name: GeneralService
    icon: general_service
    menus:
      - name: Services
        layer: GENERAL
      - name: VisualDatabase
        layer: VIRTUAL_DATABASE
      - name: VisualCache
        layer: VIRTUAL_CACHE
      - name: VisualMQ
        layer: VIRTUAL_MQ
  ....
- name: SelfObservability
  icon: self_observability
  menus:
    - name: SkyWalkingServer
      layer: SO11Y_OAP
    - name: Satellite
      layer: SO11Y_SATELLITE
The menu items would automatically pop up on the left after short period of time that at least one service was observed. For more details, please refer to the “uiMenuRefreshInterval” configuration item in the backend settings
Custom Dashboard
Besides official dashboards, Dashboards provide customization capabilities to end-users to add new tabs/pages/widgets, and flexibility to re-config the dashboard on your own preference.
The dashboard has two key attributes, Layer and Entity Type. Learn these two concepts first before you begin any customization. Also, trace, metrics, and log analysis are relative to OAL, MAL, and LAL engines in the SkyWalking kernel. It would help if you learned them first, too.
Service and All entity type dashboard could be set as root(set this to root), which means this dashboard would be used
as the entrance of its Layer. If you have multiple root dashboards, UI will choose one randomly (We don’t recommend doing
so).
Notice, dashboard editable is disabled on release; set system env(SW_ENABLE_UPDATE_UI_TEMPLATE=true) to activate them. Before you save the edited dashboard, it is just stored in memory. Closing a tab would LOSE the change permanently.
A new dashboard should be added through New Dashboard in the Dashboards menu.
Meanwhile, there are two ways to edit an existing dashboard.
Dashboard Listin theDashboardmenu provides edit/delete/set-as-root features to manage existing dashboards.- In every dashboard page, click the right top
Vtoggle, and turn toE(representing Edit) mode.
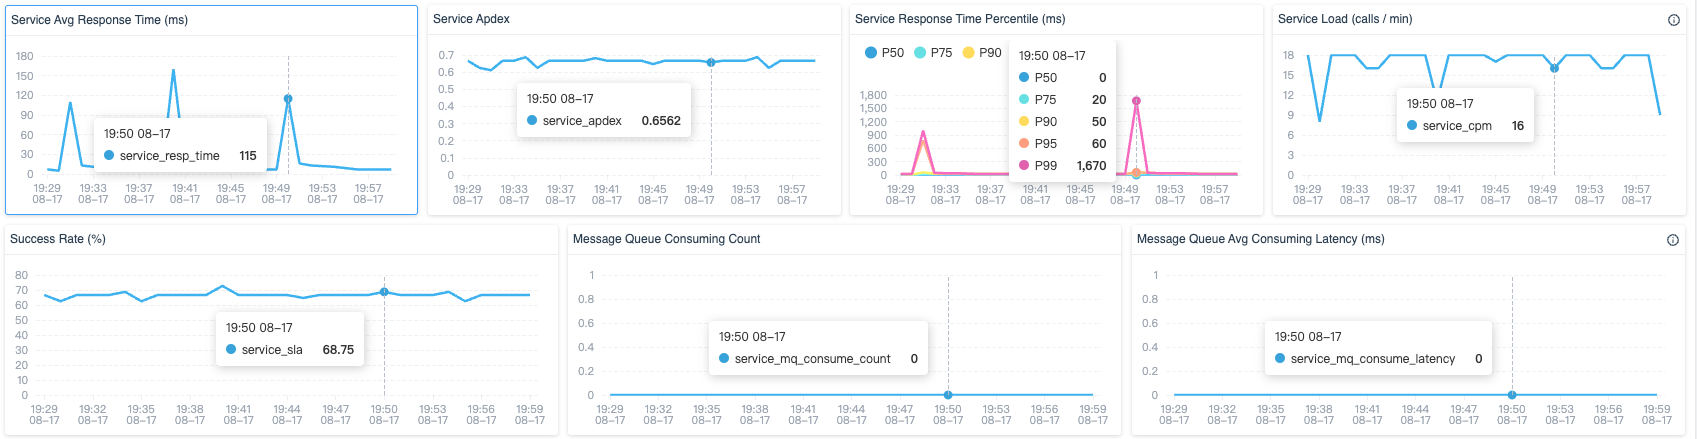
Widget
A dashboard consists of various widget. In the Edit mode, widgets could be added/moved/removed/edit according to the Layer.(Every widget declares its suitable layer.)
The widget provides the ability to visualize the metrics, generated through OAL, MAL, or LAL scripts.
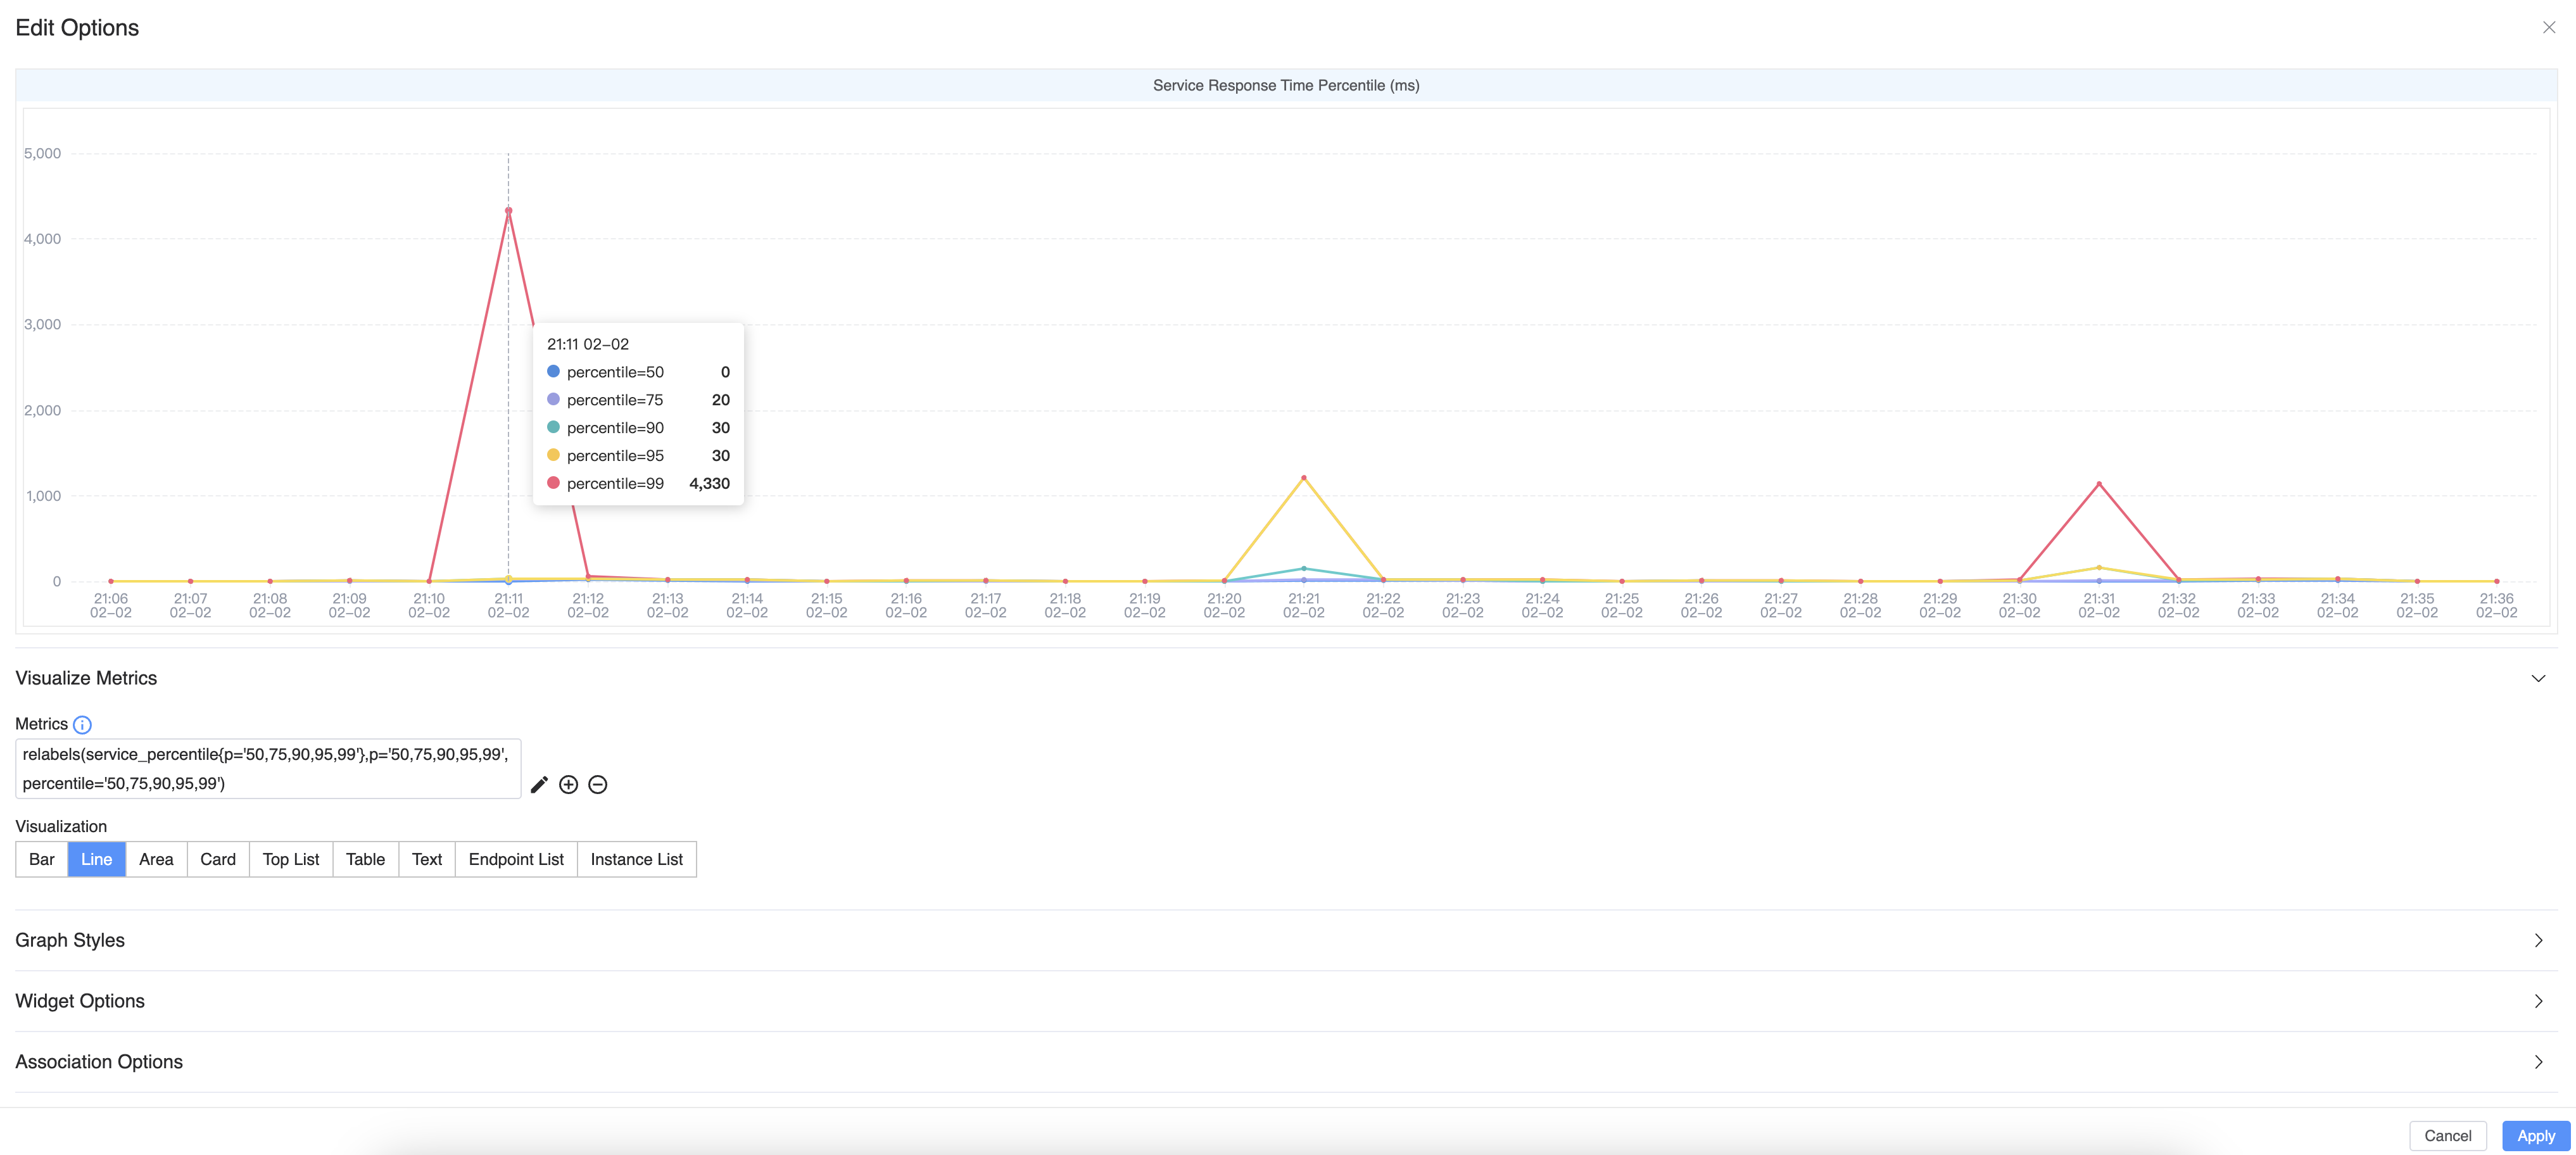
Metric Query Expression
Metric Query Expression provides the ability to query metrics from the backend. The query expression could be a simple metric name, or a complex expression with multiple functions. Read Metrics Query Expression(MQE) Syntax doc to learn more about the syntax.
Graph styles
Setup font size, unit, value mappings etc. to provide better visualization.
Widget options
Define the following properties of the widget:
- Name: The name of the widget, which used to associate with other widget in the dashboard.
- Title: The title name of the widget.
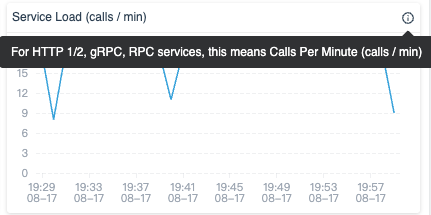
- Tooltip Content: Additional explanation of the widget.
Association Options
Widget provides the ability to associate with other widgets to show axis pointer with tips for the same time point, in order to help users to understand the connectivity among metrics.
Widget Static Link
On the right top of every widget on the dashboard, there is a Generate Link option, which could generate a static
link to represent this widget.
By using this link, users could share this widget, or integrate it into any 3rd party iFrame to build a
network operations center(NOC) dashboard on the wall easily.
About this link, there are several customizable options
Lock Query Duration. Set the query duration manually. It is OFF by default.Auto Freshoption is ON with 6s query period and last 30 mins time range. Query period and range are customizable.
Settings
Settings provide language, server time zone, and auto-fresh options.
- The language preference setting is stored in the browser’s local storage. Unless you clear them manually, those will not change.
- The server timezone should be automatically loaded from server side, unless you need to set manually.
- Refresh time is temporary setup, it will be reset the next time.
FAQ
Login and Authentication
SkyWalking doesn’t provide login and authentication as usual for years. If you need, a lot of Gateway solutions have provides well-established solutions, such as the Nginx ecosystem.