Meet Horizon UI · 4/17: The Deployment Tab & BanyanDB Self-Observability
This is the fourth post in the Meet Horizon UI series. Part 3 drew the map between services. This one turns the same map inward — onto the instances inside one clustered service — and uses it for something SkyWalking has never shown well before: its own storage engine, BanyanDB, modeled as the cluster it actually is.
The Deployment tab: a map of one service’s own instances
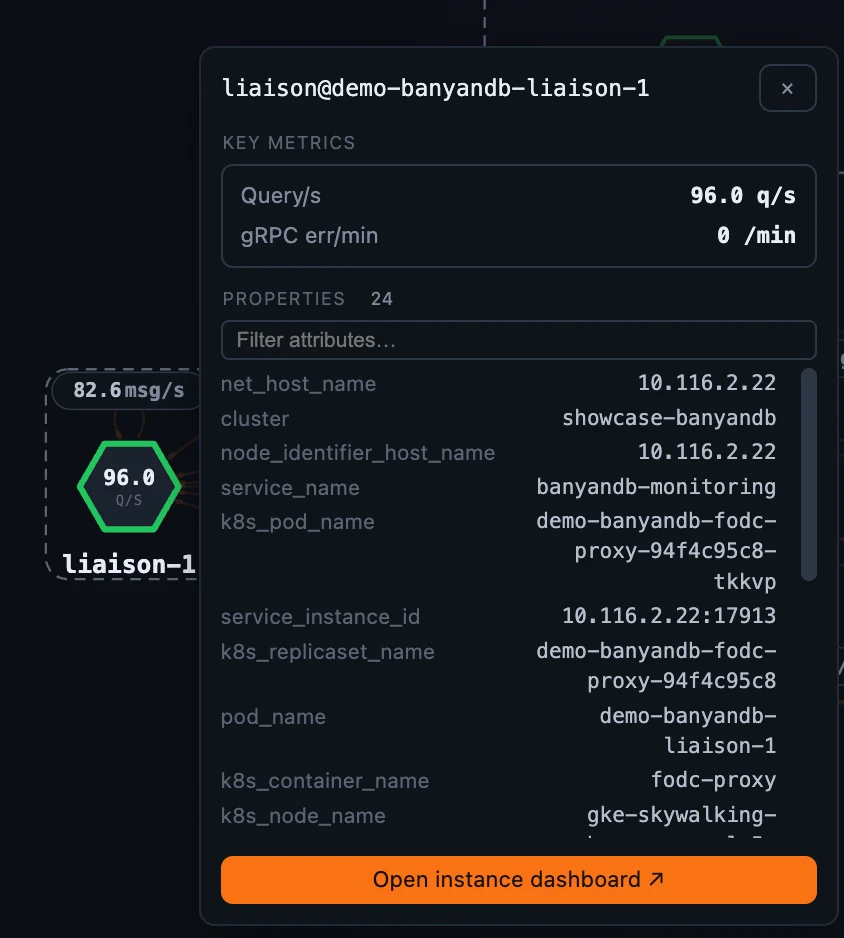
The service map answers “who calls this service.” The new per-layer Deployment tab answers a different question: “how is this one service deployed, and how do its own instances talk to each other?” Pick a service and the tab draws its instances as nodes with the instance-to-instance calls between them — the same pan/zoom canvas, health-ring nodes, animated edge flow and per-call metric sidebar you know from the service map, but scoped to a single service’s internals.
Three things make it more than a flat node cloud:
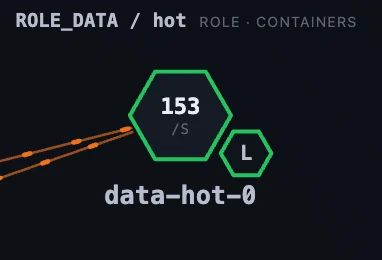
- Instances render as hexagons that bundle into pods. A pod’s main container is a full hex with its sibling containers attached as smaller hexes around its edge — so a main process and its sidecars read as one unit, and a cross-pod sidecar link connects the exact small hex it belongs to.
- Pods cluster into labelled boxes by a rule you choose — a single instance attribute (role), several attributes combined (e.g.
node_role+node_type), or a name regex — so a fleet of mixed-role nodes reads as one box per role instead of a cloud. - The layout is tiered. Each cluster box lays its pods out by call depth — sources on the left, what they call to the right — so an upstream→downstream chain reads left-to-right; drag any pod and its box re-flows to keep everything enclosed.
Edges are keyed by the (source-role → target-role) pair, so each kind of link shows its own metrics rather than one flat set, prints its headline number inline on the edge, and lists in full in a Flows sub-tab — one aligned table per role-pair. It’s off by default and, like the service map, entirely configured from the Layer dashboards admin → Deployment scope.
BanyanDB, watched like everything else
That machinery exists for a reason. SkyWalking’s native database, BanyanDB, is a clustered, role- and tier-aware system — and until now SkyWalking couldn’t really observe it as one. The new BanyanDB layer (under Self-Observability), pairing with OAP backend SWIP-15, models the whole deployment from metrics scraped through BanyanDB’s FODC proxy:
- the cluster is one Cluster (a service),
- each container is one Container (an instance, carrying its
container_namerole andnode_typetier as attributes), - and each storage Group is an endpoint.
So the same Service / Instance / Endpoint spine every other layer uses now means Cluster / Container / Group for BanyanDB — and the Deployment tab on top of it draws the cluster itself.
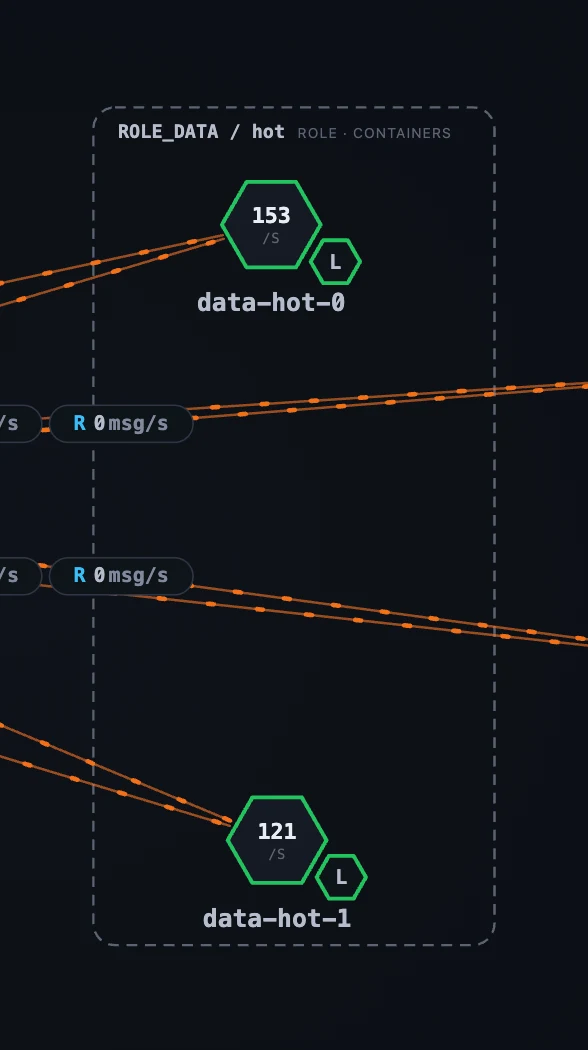
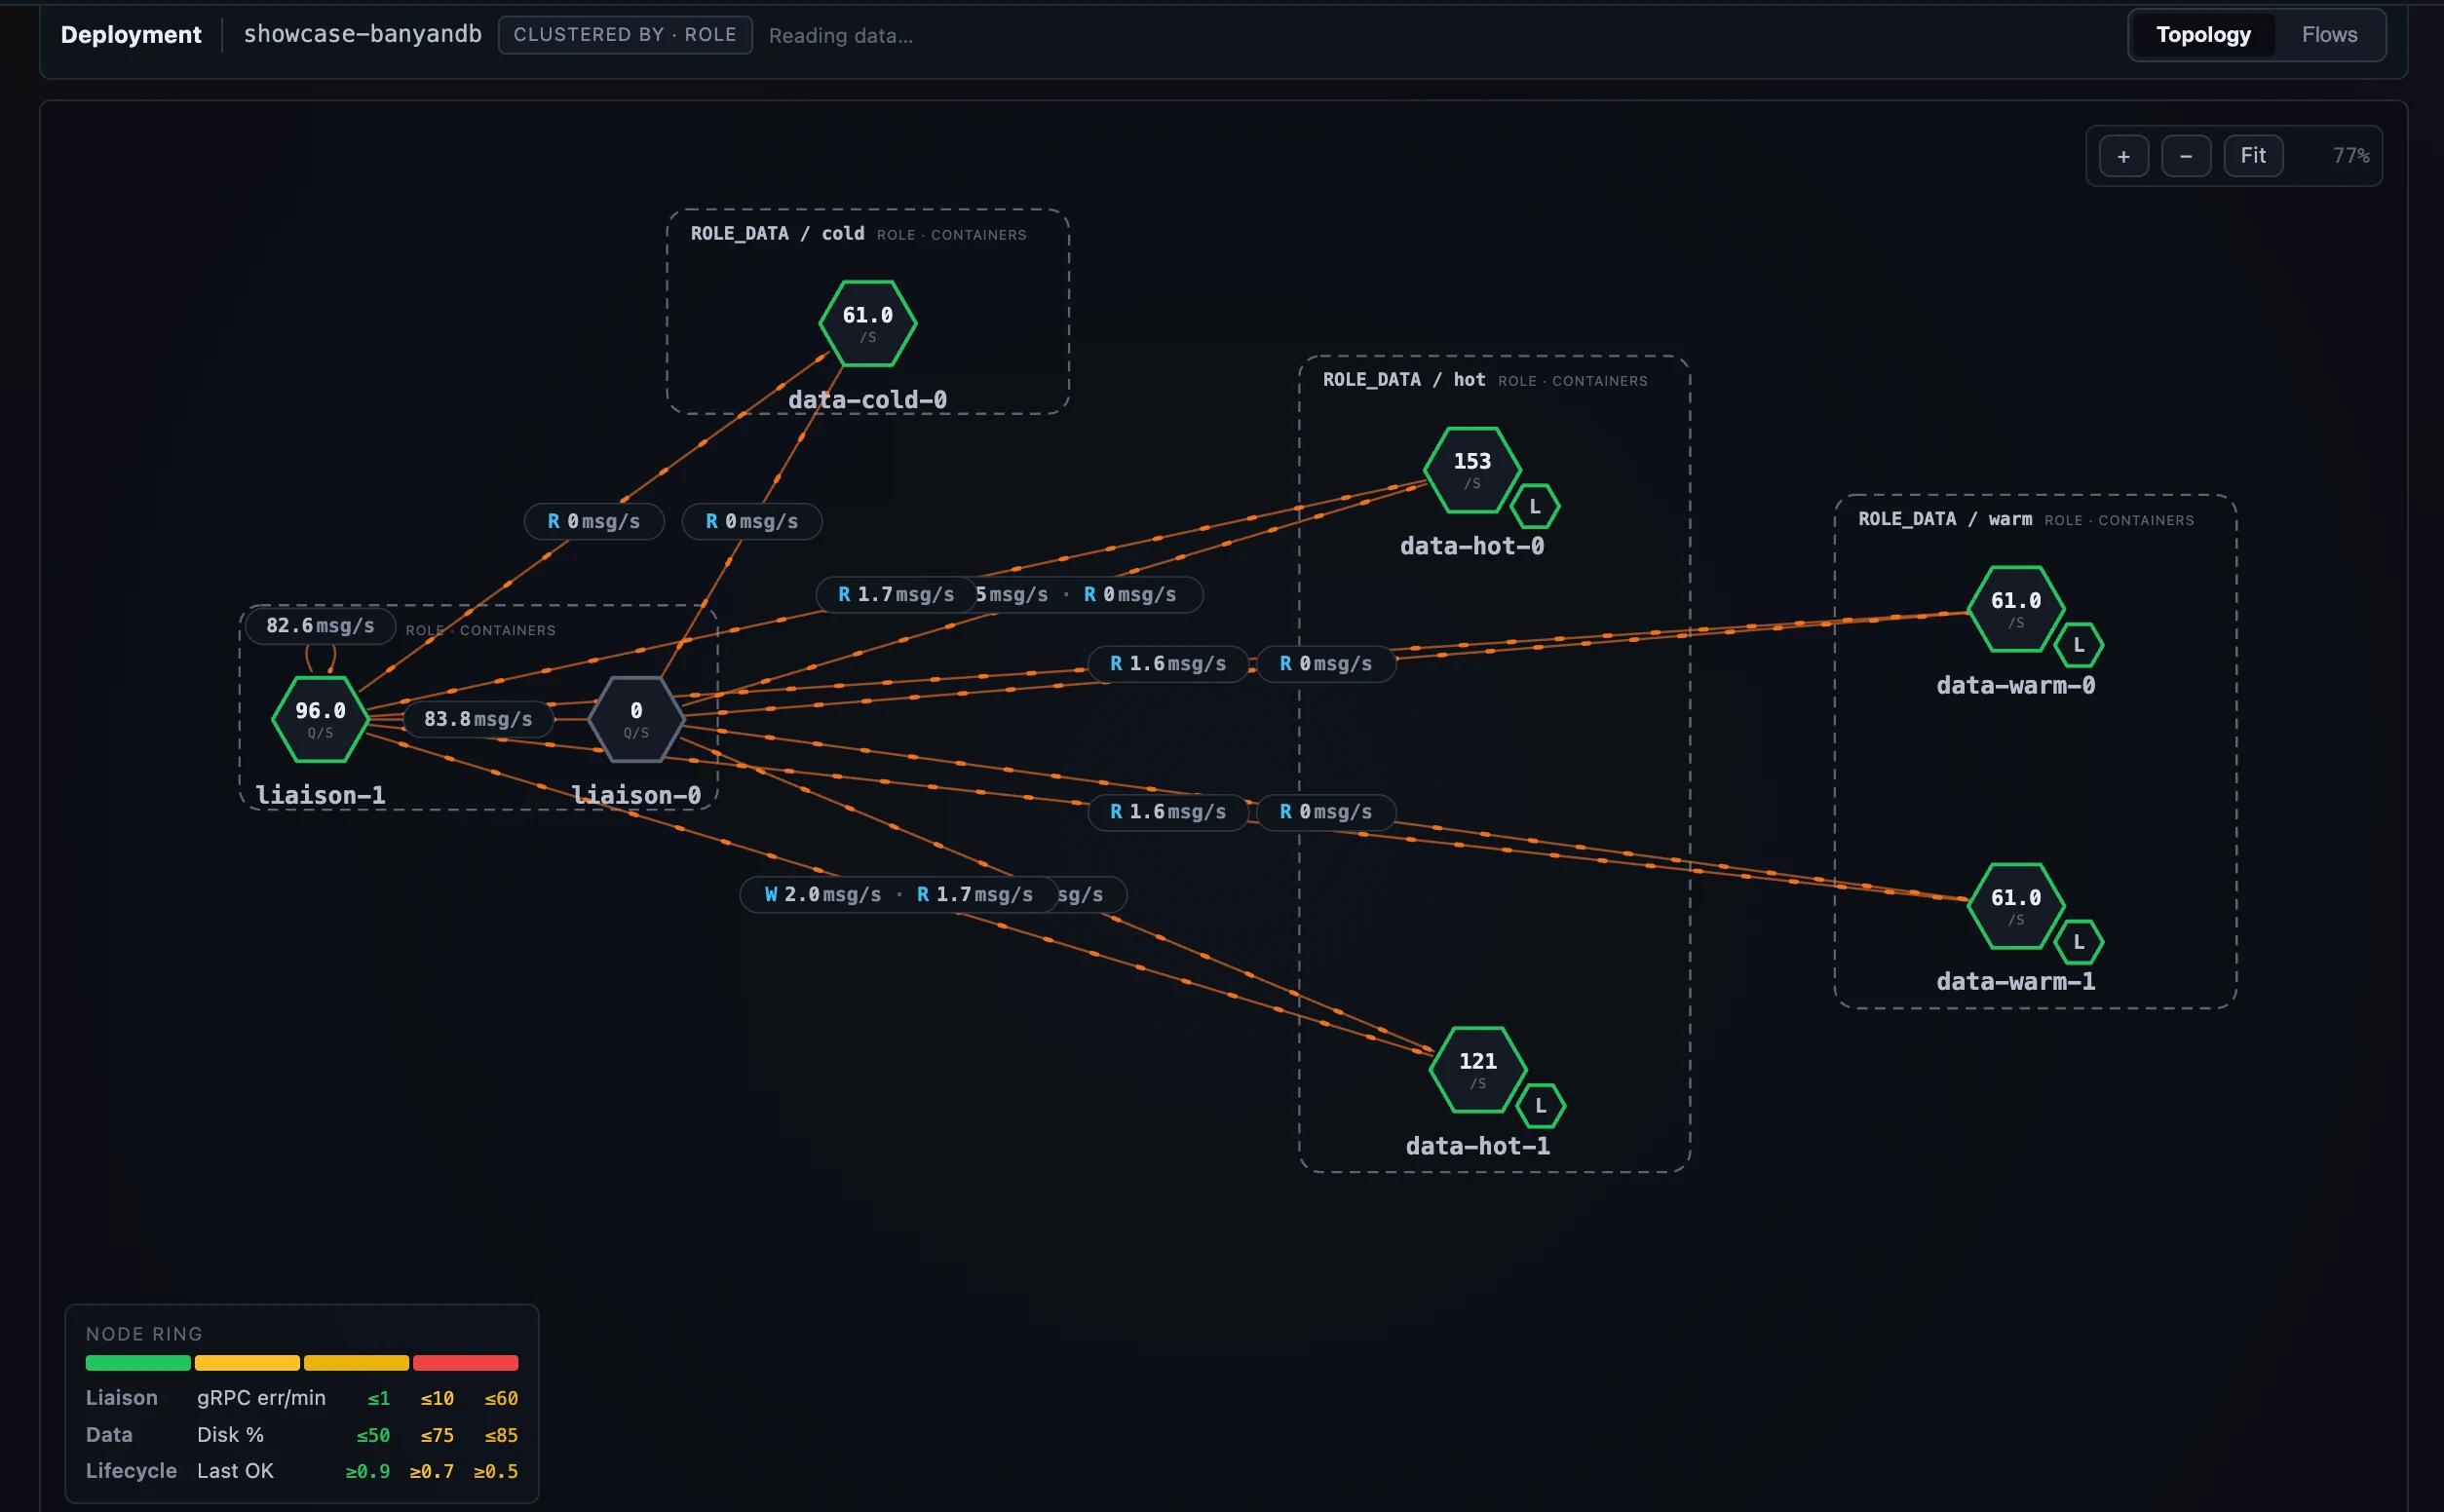 Figure 1: SkyWalking watching its own database — the BanyanDB cluster drawn by role and tier, with liaison→data and lifecycle→data edges between the pods.
Cluster, Container, Group
Each scope is a purpose-built dashboard:
- The Cluster dashboard is the war-room for the whole database: write / query / error-rate KPIs, CPU / memory / disk capacity, throughput and error trends, and a Containers by Role table.
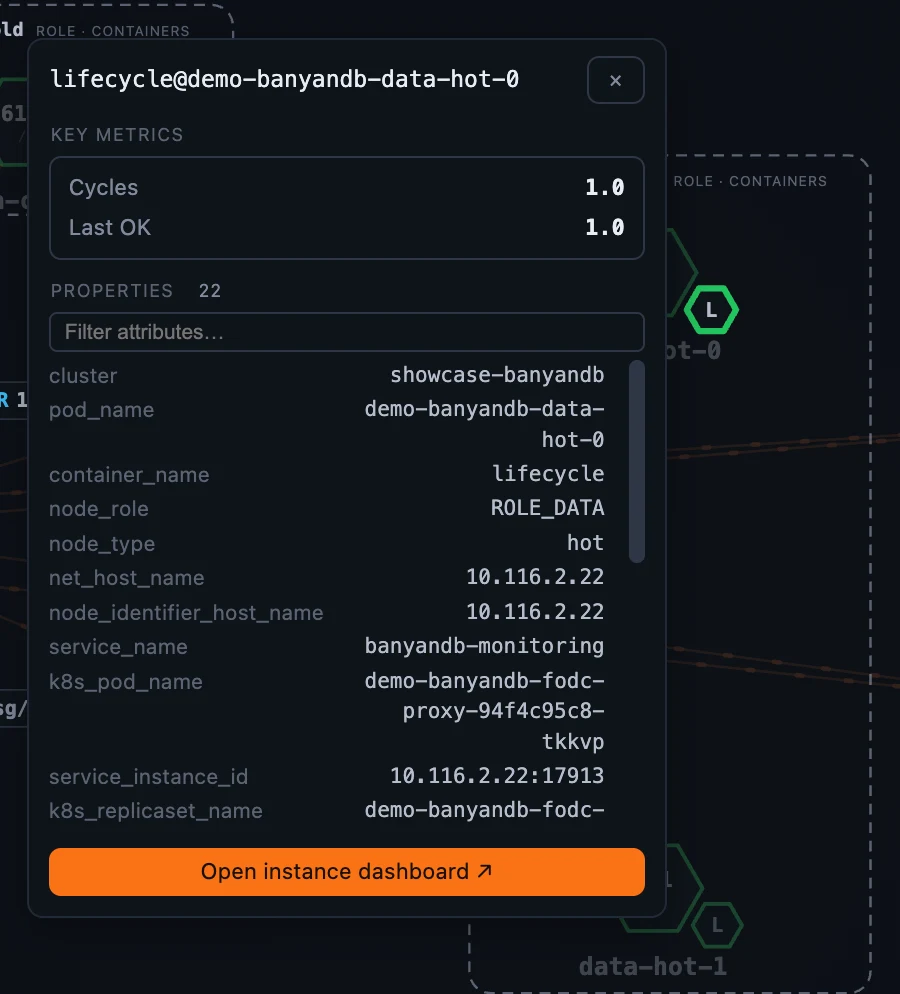
- The Container dashboard adapts to the selected container’s role. Every container shows CPU / memory / Go-runtime resources; a liaison adds ingestion, query, gRPC errors and the tier-2 publish pipeline and write-queue depth; a data node adds storage totals, merge / compaction, the inverted index, the subscribe queue and retention; a lifecycle sidecar shows migration cycles and last-run time / status. The role-specific panels are gated on the container’s role attribute, so you only ever see what applies to the node in front of you.
- The Group dashboard splits per data-model — measure, stream, trace, property — and because a BanyanDB group stores exactly one catalog, only the matching model’s panels render: a
measuregroup shows write-rate / query-latency / merge panels, apropertygroup its index-write / term-search / series panels, and so on.
The role-gating is easiest to see by opening the same Container dashboard on two different roles:
And the Group scope gives each storage catalog its own page:
Edges that know their role pair, and a Flows table
On the Deployment tab, the call edges between containers carry role-pair-specific metrics off the SWIP-15 instance-relation families: a liaison → data edge shows write / query / part-sync throughput and p99; a liaison → liaison edge shows write-forward and control; a lifecycle → data edge shows tier-migration volume / rate / p99. Each edge prints up to three of its pair’s metrics inline, the selected-edge panel keeps the full client-vs-server breakdown, and the Flows sub-tab lays every edge out as one aligned table per role-pair.
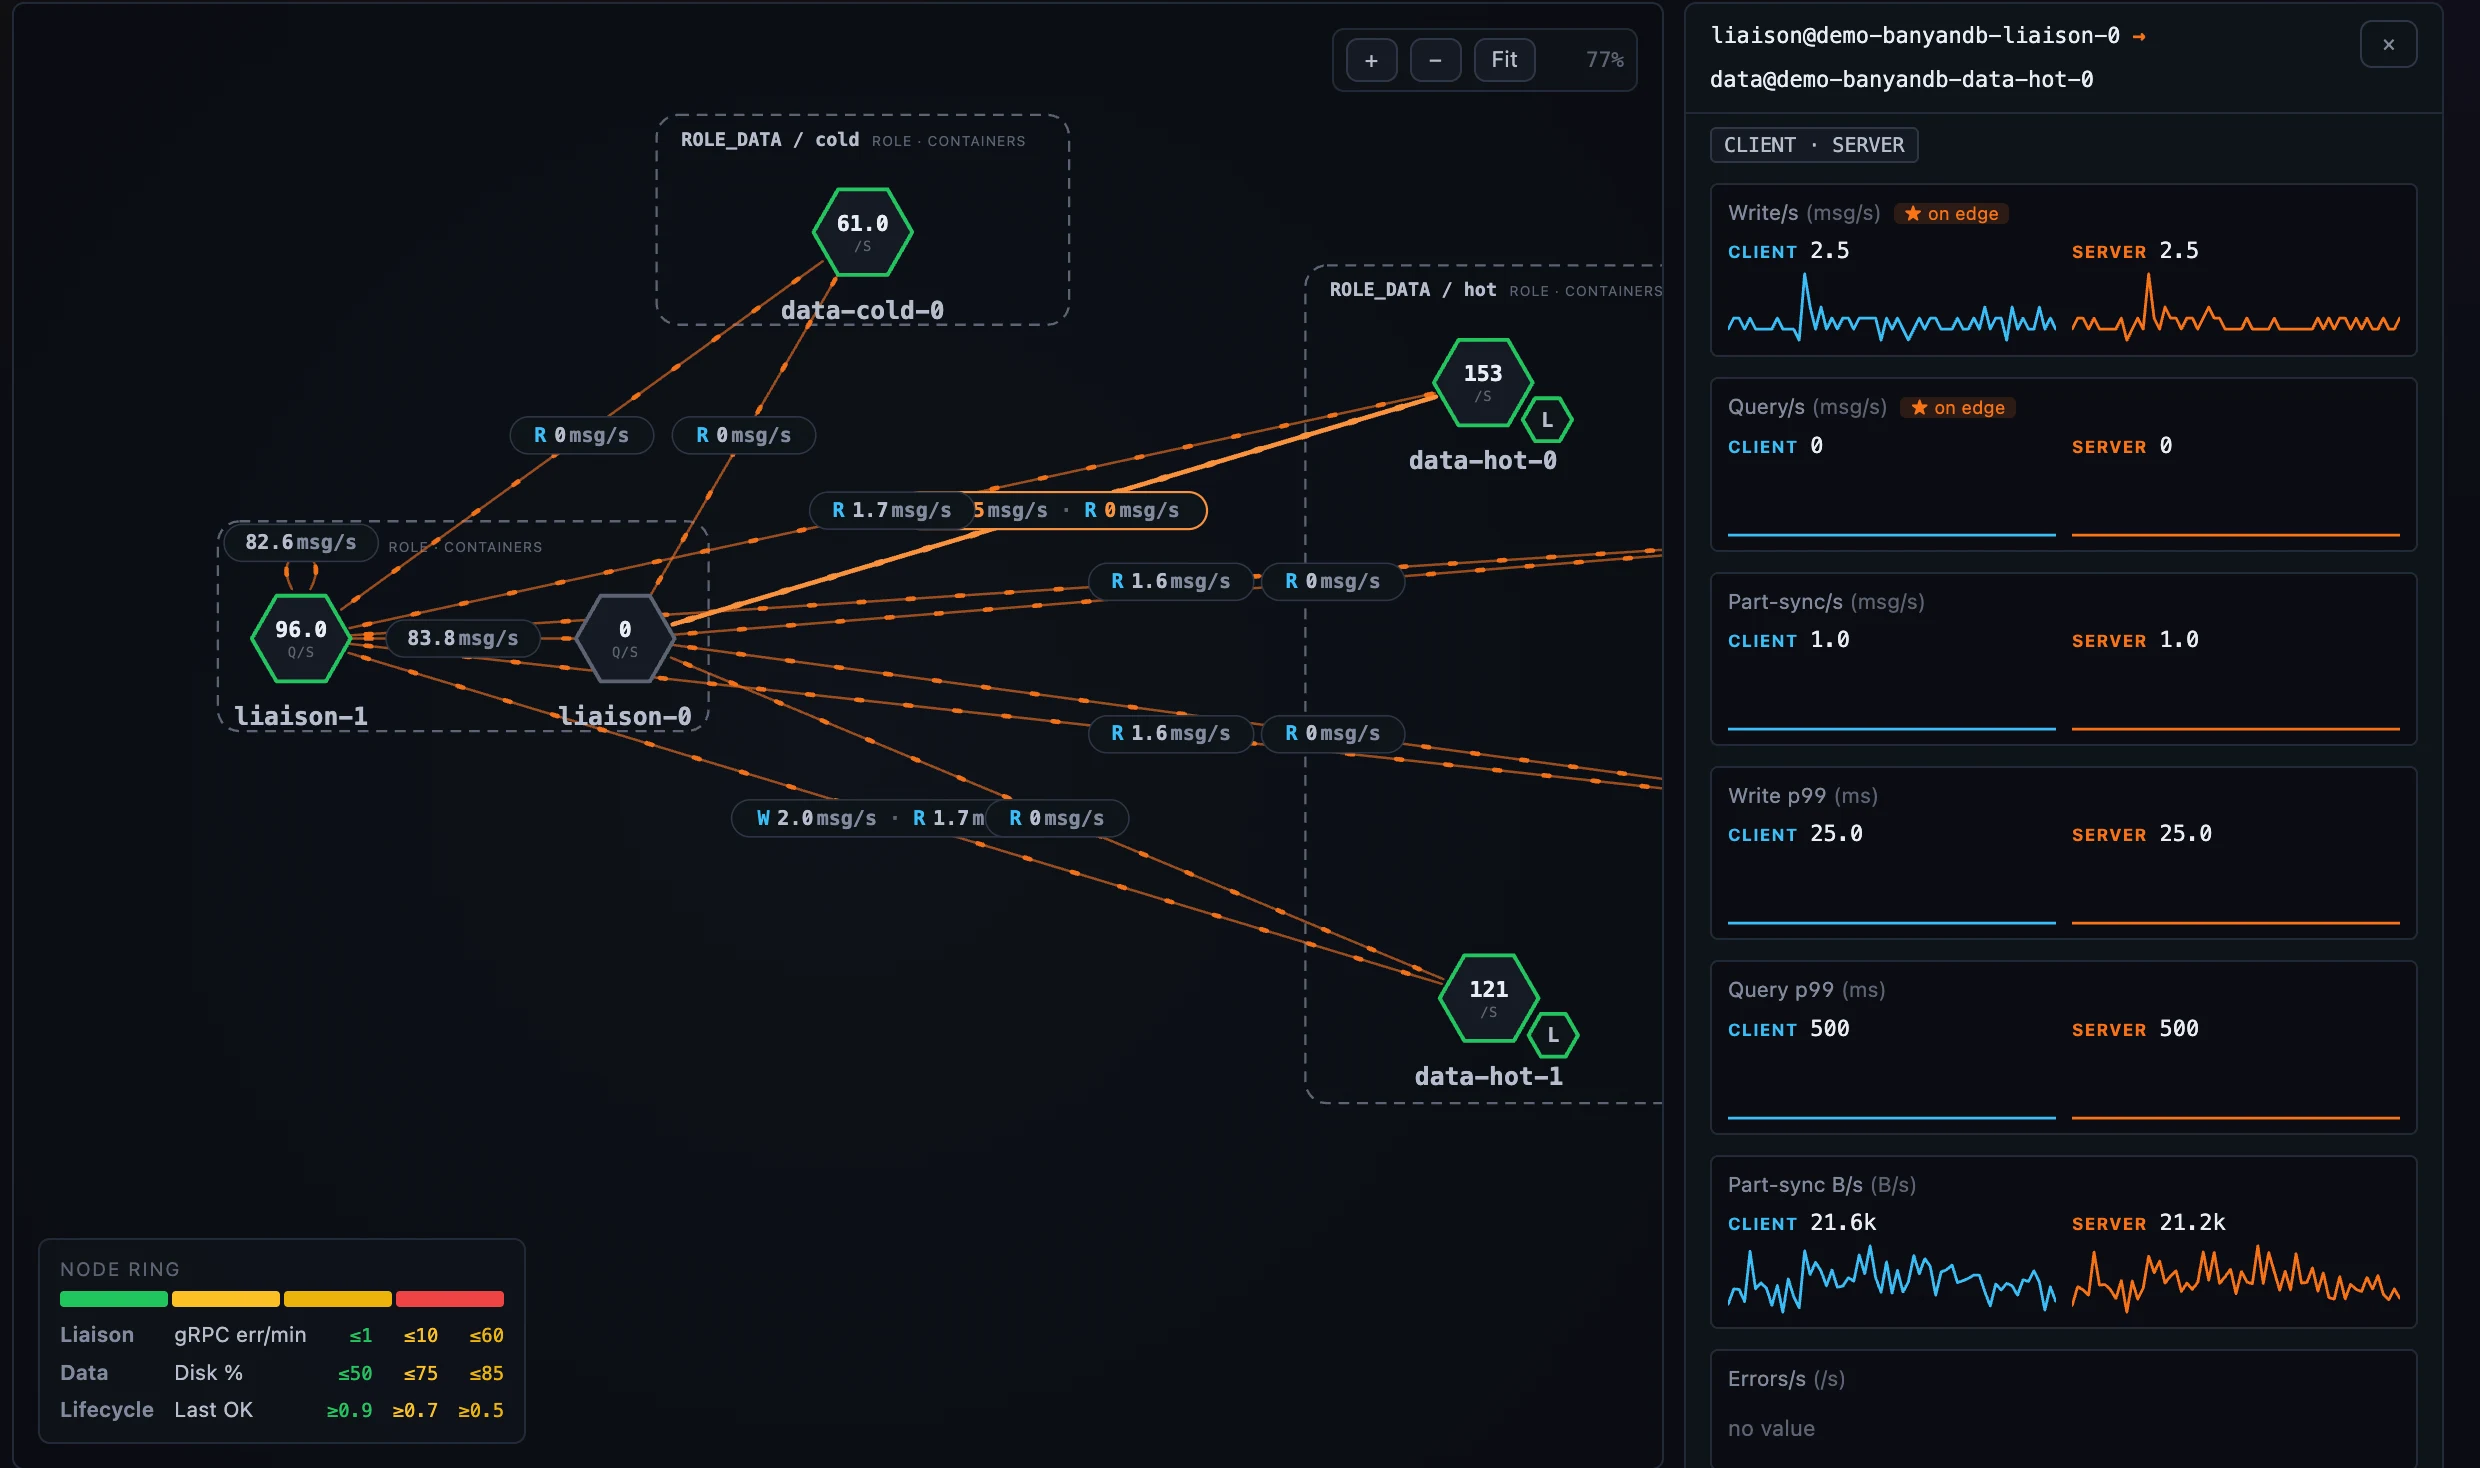 Figure 6: Flows — the same role-pair edges as a sortable table, one block per pair.
(Two preconditions. The edges and the role-specific panels assume a real clustered BanyanDB — a single-process standalone instance shows only the shared resource and Go-runtime panels, with the rest lighting up as the cluster’s roles report. And the container-to-container edges in particular need the OAP build to expose the SERVICE_INSTANCE_RELATION scope; until it does, the Deployment tab still draws the full inventory — just without the edges between pods.)
Configured, not coded
None of the above is a hand-built “BanyanDB screen.” The clustering rules, the per-role node metrics, and the role-pair edge metrics are all a self-contained block on the layer template, edited from the Layer dashboards admin → Deployment scope and carried with the template’s export/import — the same config-driven model behind every other layer, which a later post covers end to end.
For the BanyanDB layer’s own fields — the Cluster, Container, Group, and Deployment views — see the BanyanDB dashboards doc.
Next up: the 3D Infrastructure Map — where this same deployment, and every other layer, lifts off the page into a WebGL view of your whole estate.