Meet Horizon UI · 1/17: SkyWalking's New Observability Console
Apache SkyWalking Horizon UI is the next-generation web console for SkyWalking. It talks to the same OAP backend SkyWalking already runs — the same GraphQL query protocol, the same admin REST surface, the same MQE language, the same Layer concept — so you can point it at a running OAP and log in without changing a thing on the backend. What changes is everything in front of that contract.
This is the first post in a series. Across it we will walk through the dashboards and the metric query language, the topology views and a WebGL 3D map of your whole deployment, the trace and log explorers, profiling, the operations surface, access control, and the config-driven customization that ties it all together. This post sets the stage: what Horizon is, the one idea the whole UI is built around, and how to put it in front of your OAP today.
Horizon is built around four verbs. You observe — topology, traces, logs, all five flavors of profiling, read-only alarms, and per-layer dashboards. Then you operate what you observe, govern who is allowed to touch it, and customize the whole console without writing UI code. Observe, operate, govern, customize: that is the arc of this series. We start where every session starts — the sidebar.
The sidebar is your estate
Open Horizon and the left sidebar is not a hand-built menu — it is a live reflection of what your OAP is actually reporting. Horizon asks OAP which layers exist and which of them have services, and renders exactly those, refreshing on a 60-second cadence. A layer starts reporting, it shows up; it goes quiet, it falls away. The menu can’t drift from reality because the menu is reality, polled.
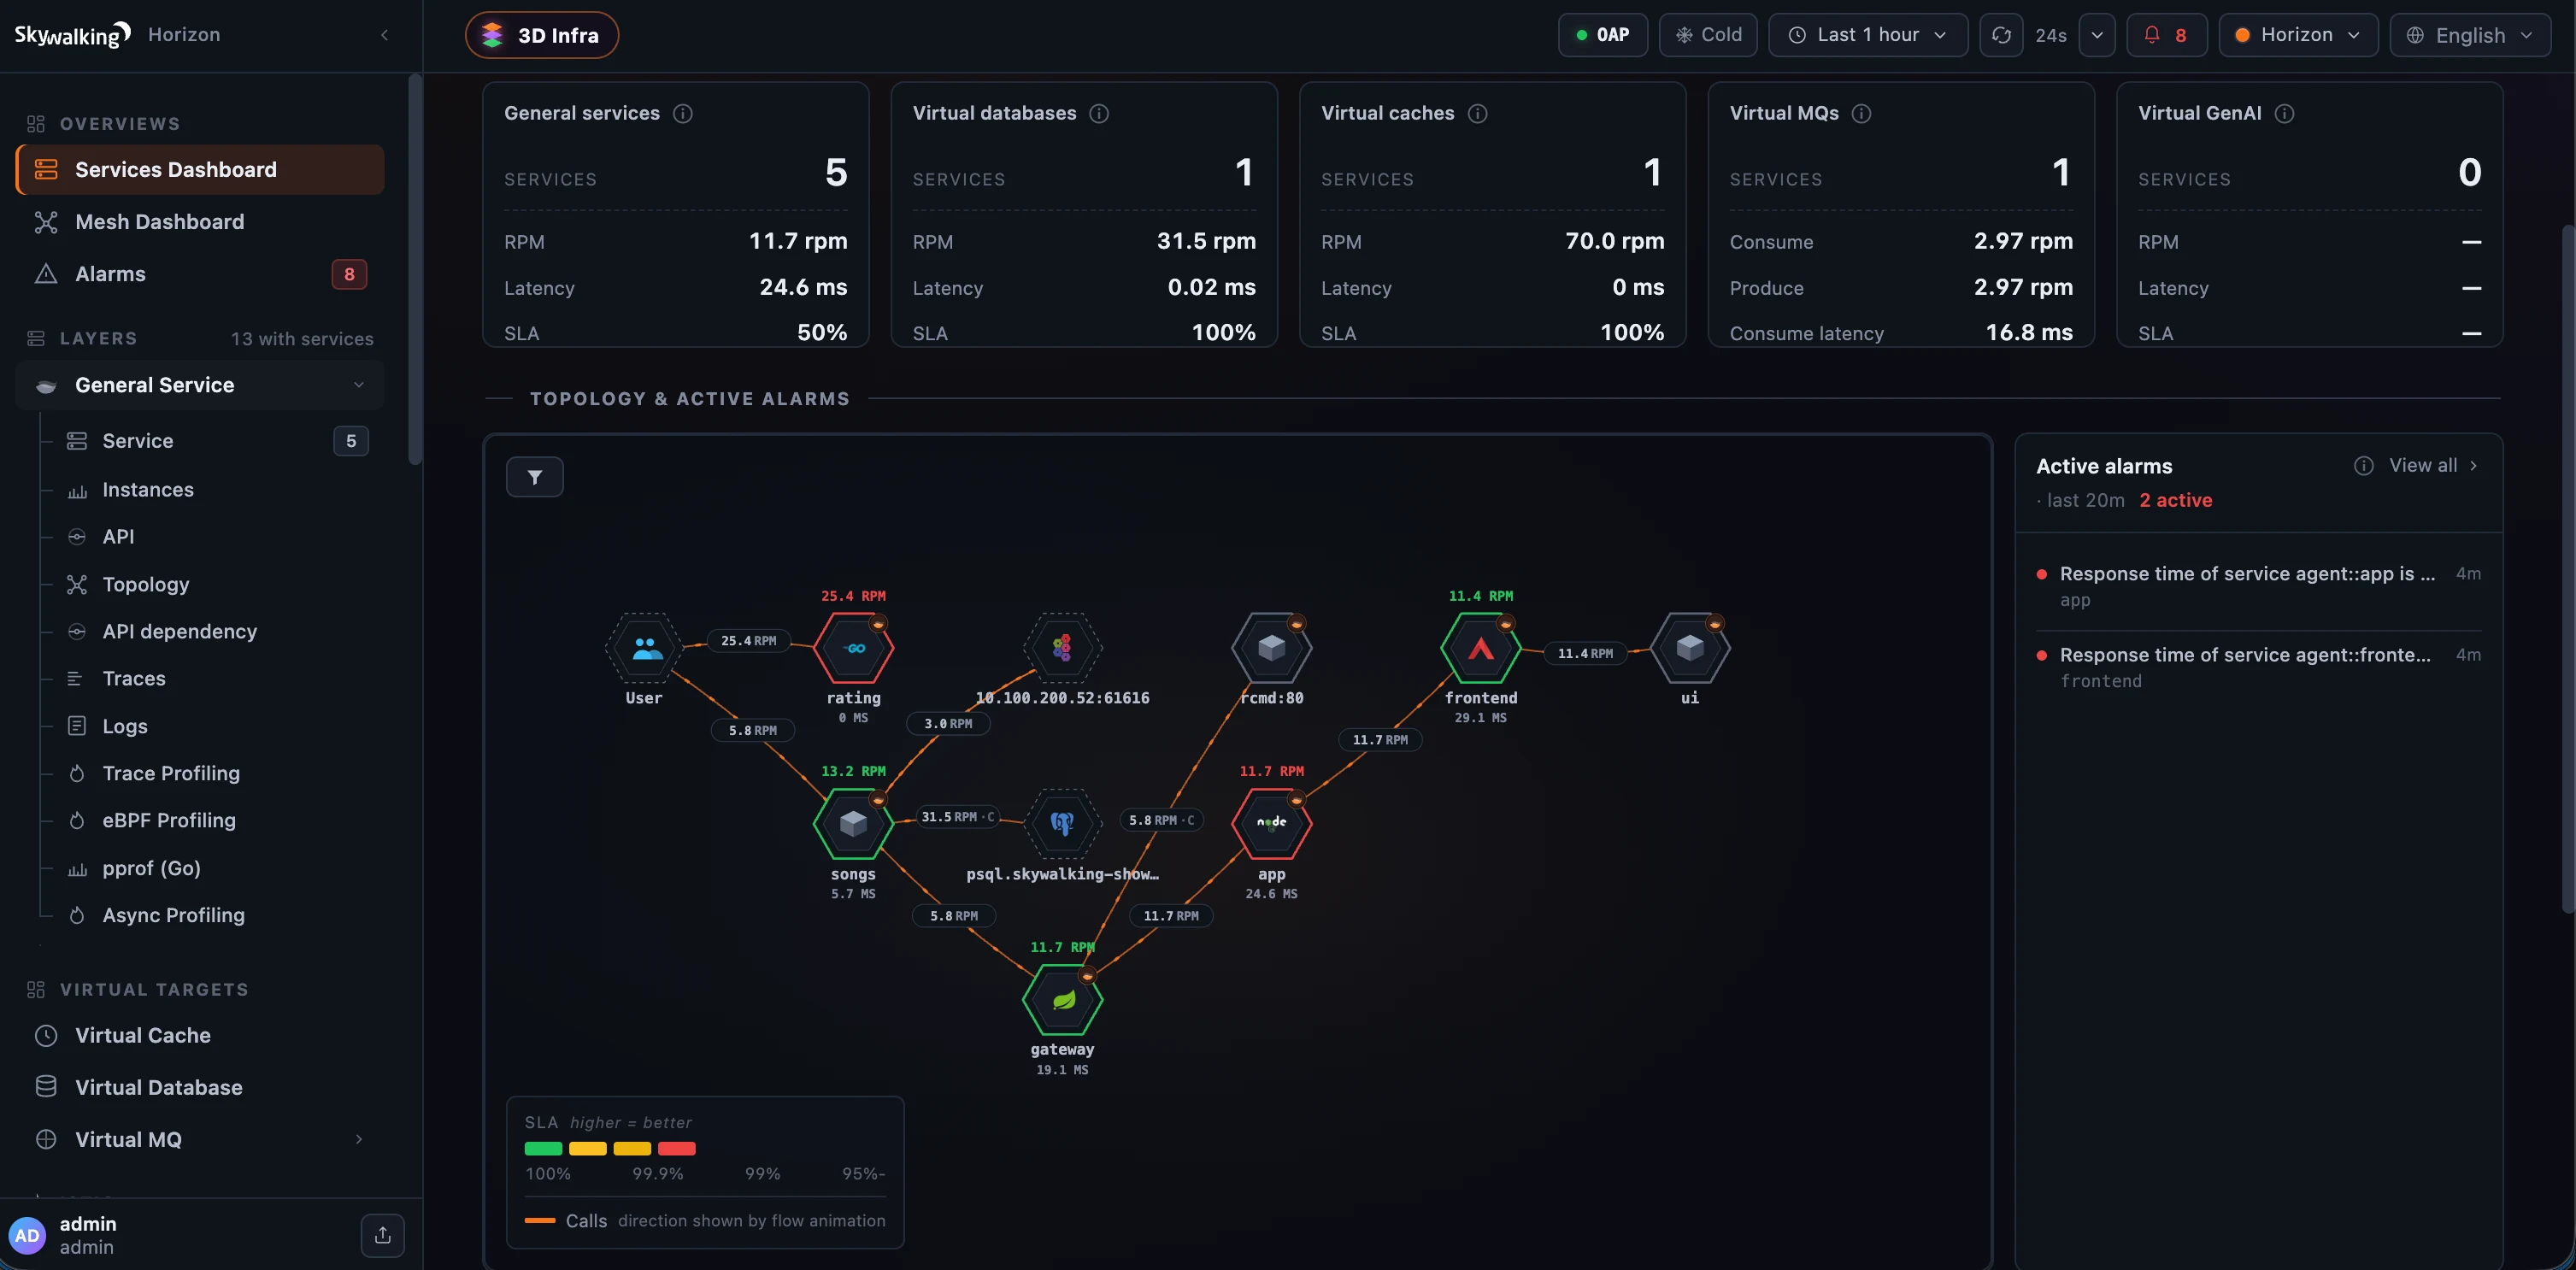 Figure 1: Horizon’s home — the live estate on the left, the cross-layer Services overview on the right.
A few things are happening in that sidebar:
- Live service counts. The Layers heading shows how many layers currently have services — 13 with services in Figure 1 — and each layer’s own count surfaces as you open it. Those counts come from a single server-side catalog the whole UI shares, refreshed once a minute, so the sidebar, the alarm layer-tagger, and the landing pages never disagree by a stale poll.
- Grouped, not a flat list. Layers cluster under their group — Virtual Targets, Istio, Kubernetes, MQ — beneath the Overviews and Alarms entries up top. Operate and admin areas (Cluster Status, Alerting rules, DSL Management, Users, Roles & permissions) appear lower down, and only for the roles allowed to open them — access control is woven into the menu itself, not bolted on after.
- Nothing silently hidden. Every layer OAP reports now appears — including ones with no bundled template, which fall back to a plain Service page. A hard-coded “hidden layers” list used to quietly drop layers like
BanyanDB; that’s gone. Hiding a layer is now an explicit choice inhorizon.yamlvialayers.excluded(which ships defaulting toFAASandVIRTUAL_GATEWAY— clear the list to surface everything).
Click into any layer and Horizon opens its first available tab, following a consistent spine across every layer:
service → instance → endpoint → topology → trace → logs → profiling
The slot names follow the layer. The General Service layer in Figure 2 labels its endpoint slot API, adds an API dependency view, and fans Profiling into the engines it actually has — Trace, eBPF, pprof (Go), and Async. Tabs a layer can’t support are simply turned off in its template, so you never land on an empty page. Pick a service and its dashboard fills the canvas to the right — a header strip of KPIs (RPM, Apdex, error rate, each with its own sparkline) over a widget grid scoped to exactly that entity.
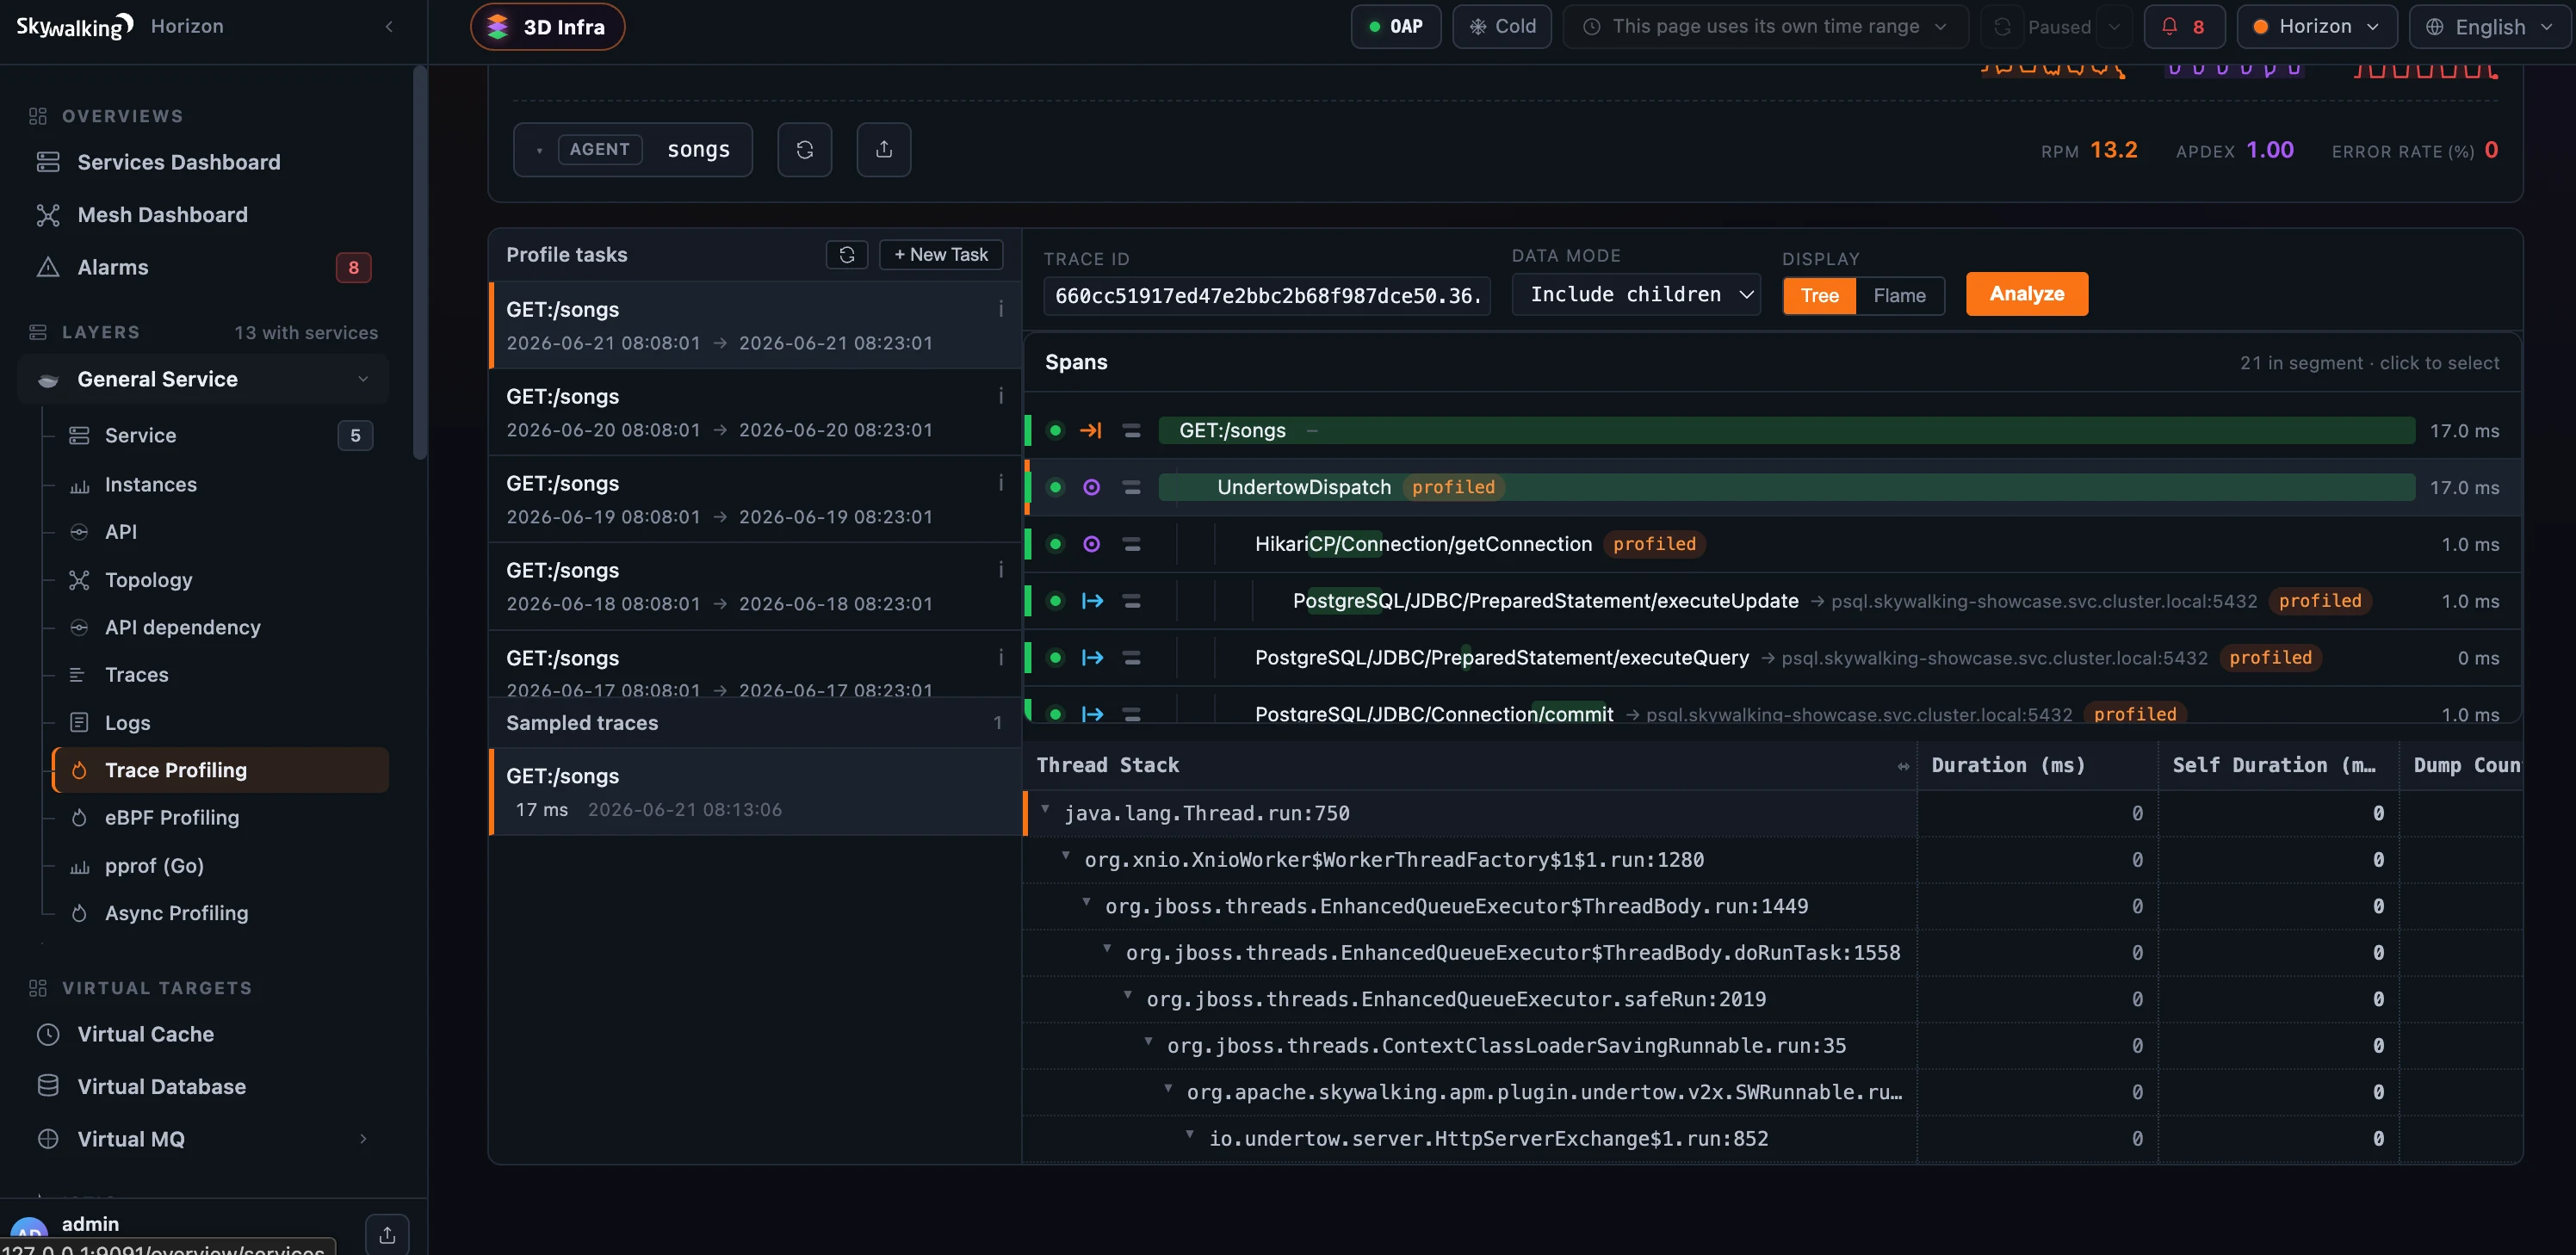 Figure 2: Expand a layer and it fans out into its full workflow — the tab spine on the left, the selected service’s dashboard on the right.
Never a blank page
A console that follows live data has to handle the moments when there isn’t any — a fresh install, a partially configured deployment, an OAP that just restarted. Horizon treats those as first-class states instead of dead ends.
Open the app at / and Horizon cascades to a real destination: the first available public overview dashboard, or failing that the first layer with services, and only if neither exists, the empty landing. When it does land on the empty page, it tells you which problem you have in plain language — “No data is flowing yet” (nothing is reporting) versus “No dashboard configured yet” (services exist, but no overview is set up) — and points you at your operations team rather than dropping you on a blank grid. As soon as a service reports or an operator publishes a dashboard, the next 60-second refresh replaces the empty page with the real one.
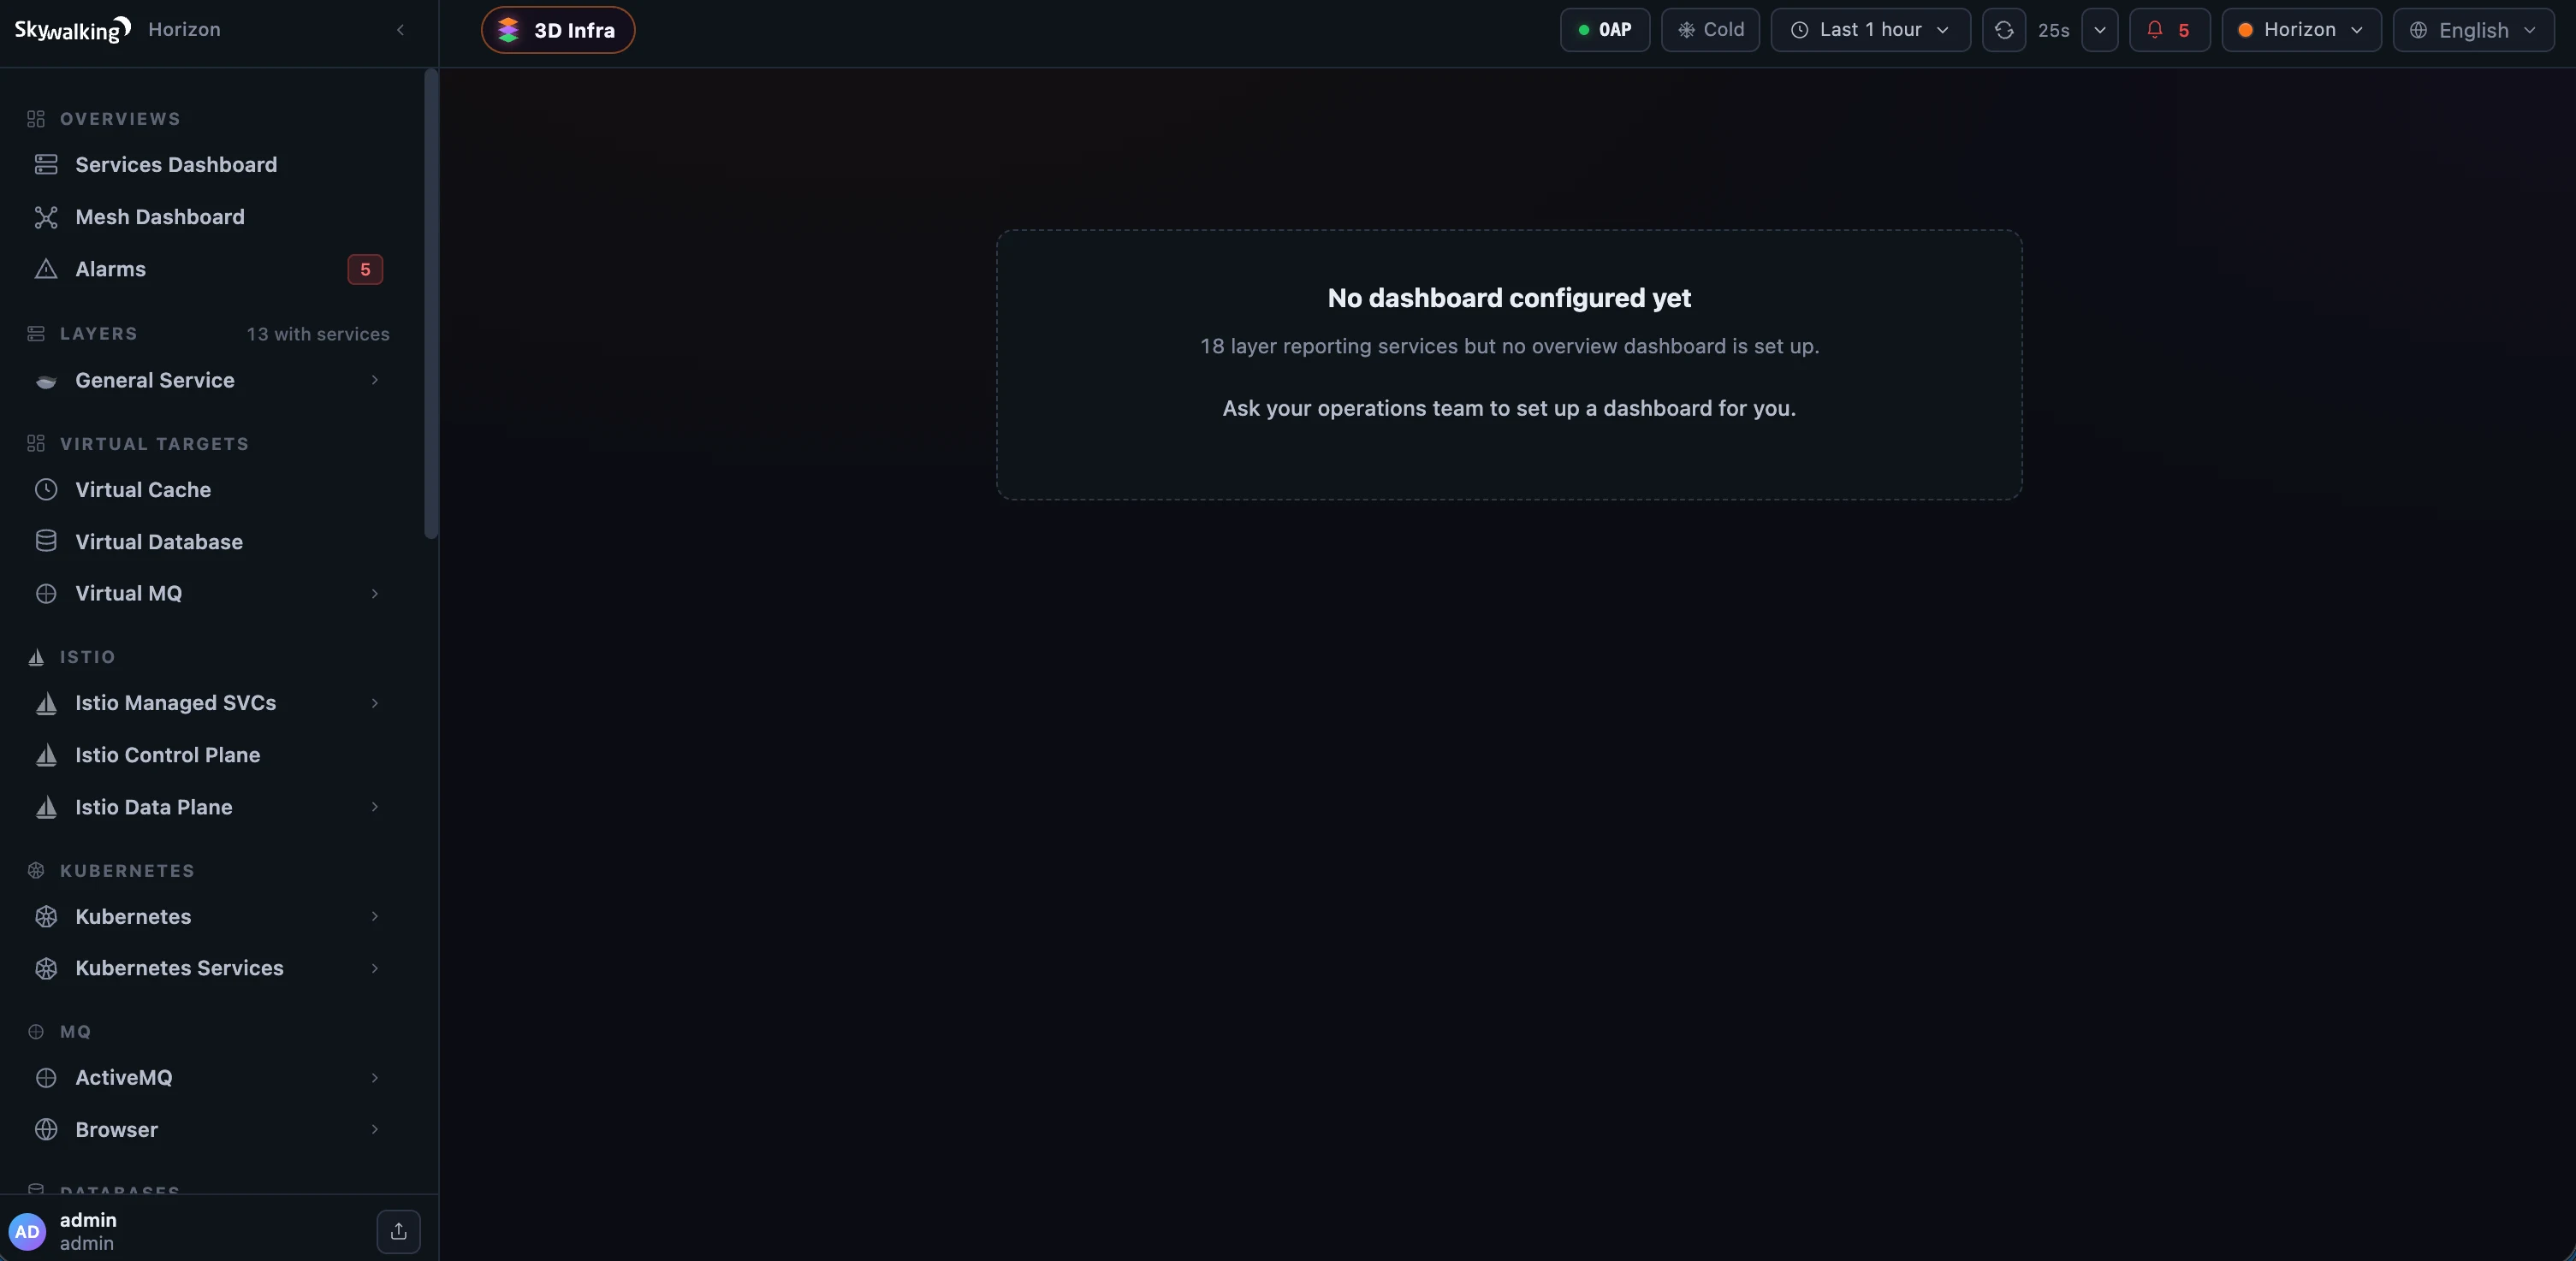 Figure 3: The empty landing names the actual situation — here, services are reporting but no overview is configured — instead of a blank dashboard.
The same instinct shows up when OAP itself blips. If the backend goes briefly unreachable, Horizon keeps the last known sidebar shape on screen and raises an “OAP unreachable” banner, with service counts marked unknown until it recovers — so a short outage never looks like your configuration vanished.
When data is flowing, that landing is the war-room you already saw in Figure 1 — a cross-layer overview with per-kind service tiles (General services, Virtual databases, caches, MQs, GenAI), the live topology, and the active-alarm rail. Per-layer landings rank the true top-N services by your chosen column (no more capping at an arbitrary first 25 before ranking) and tell you “top N of M” so the trim is never silent.
And because long layer names and deep namespaces happen, the shell gets out of the way: drag the divider to resize the sidebar (double-click to reset), or fold it to a thin icon rail to give the canvas every horizontal pixel — and the width is remembered per browser.
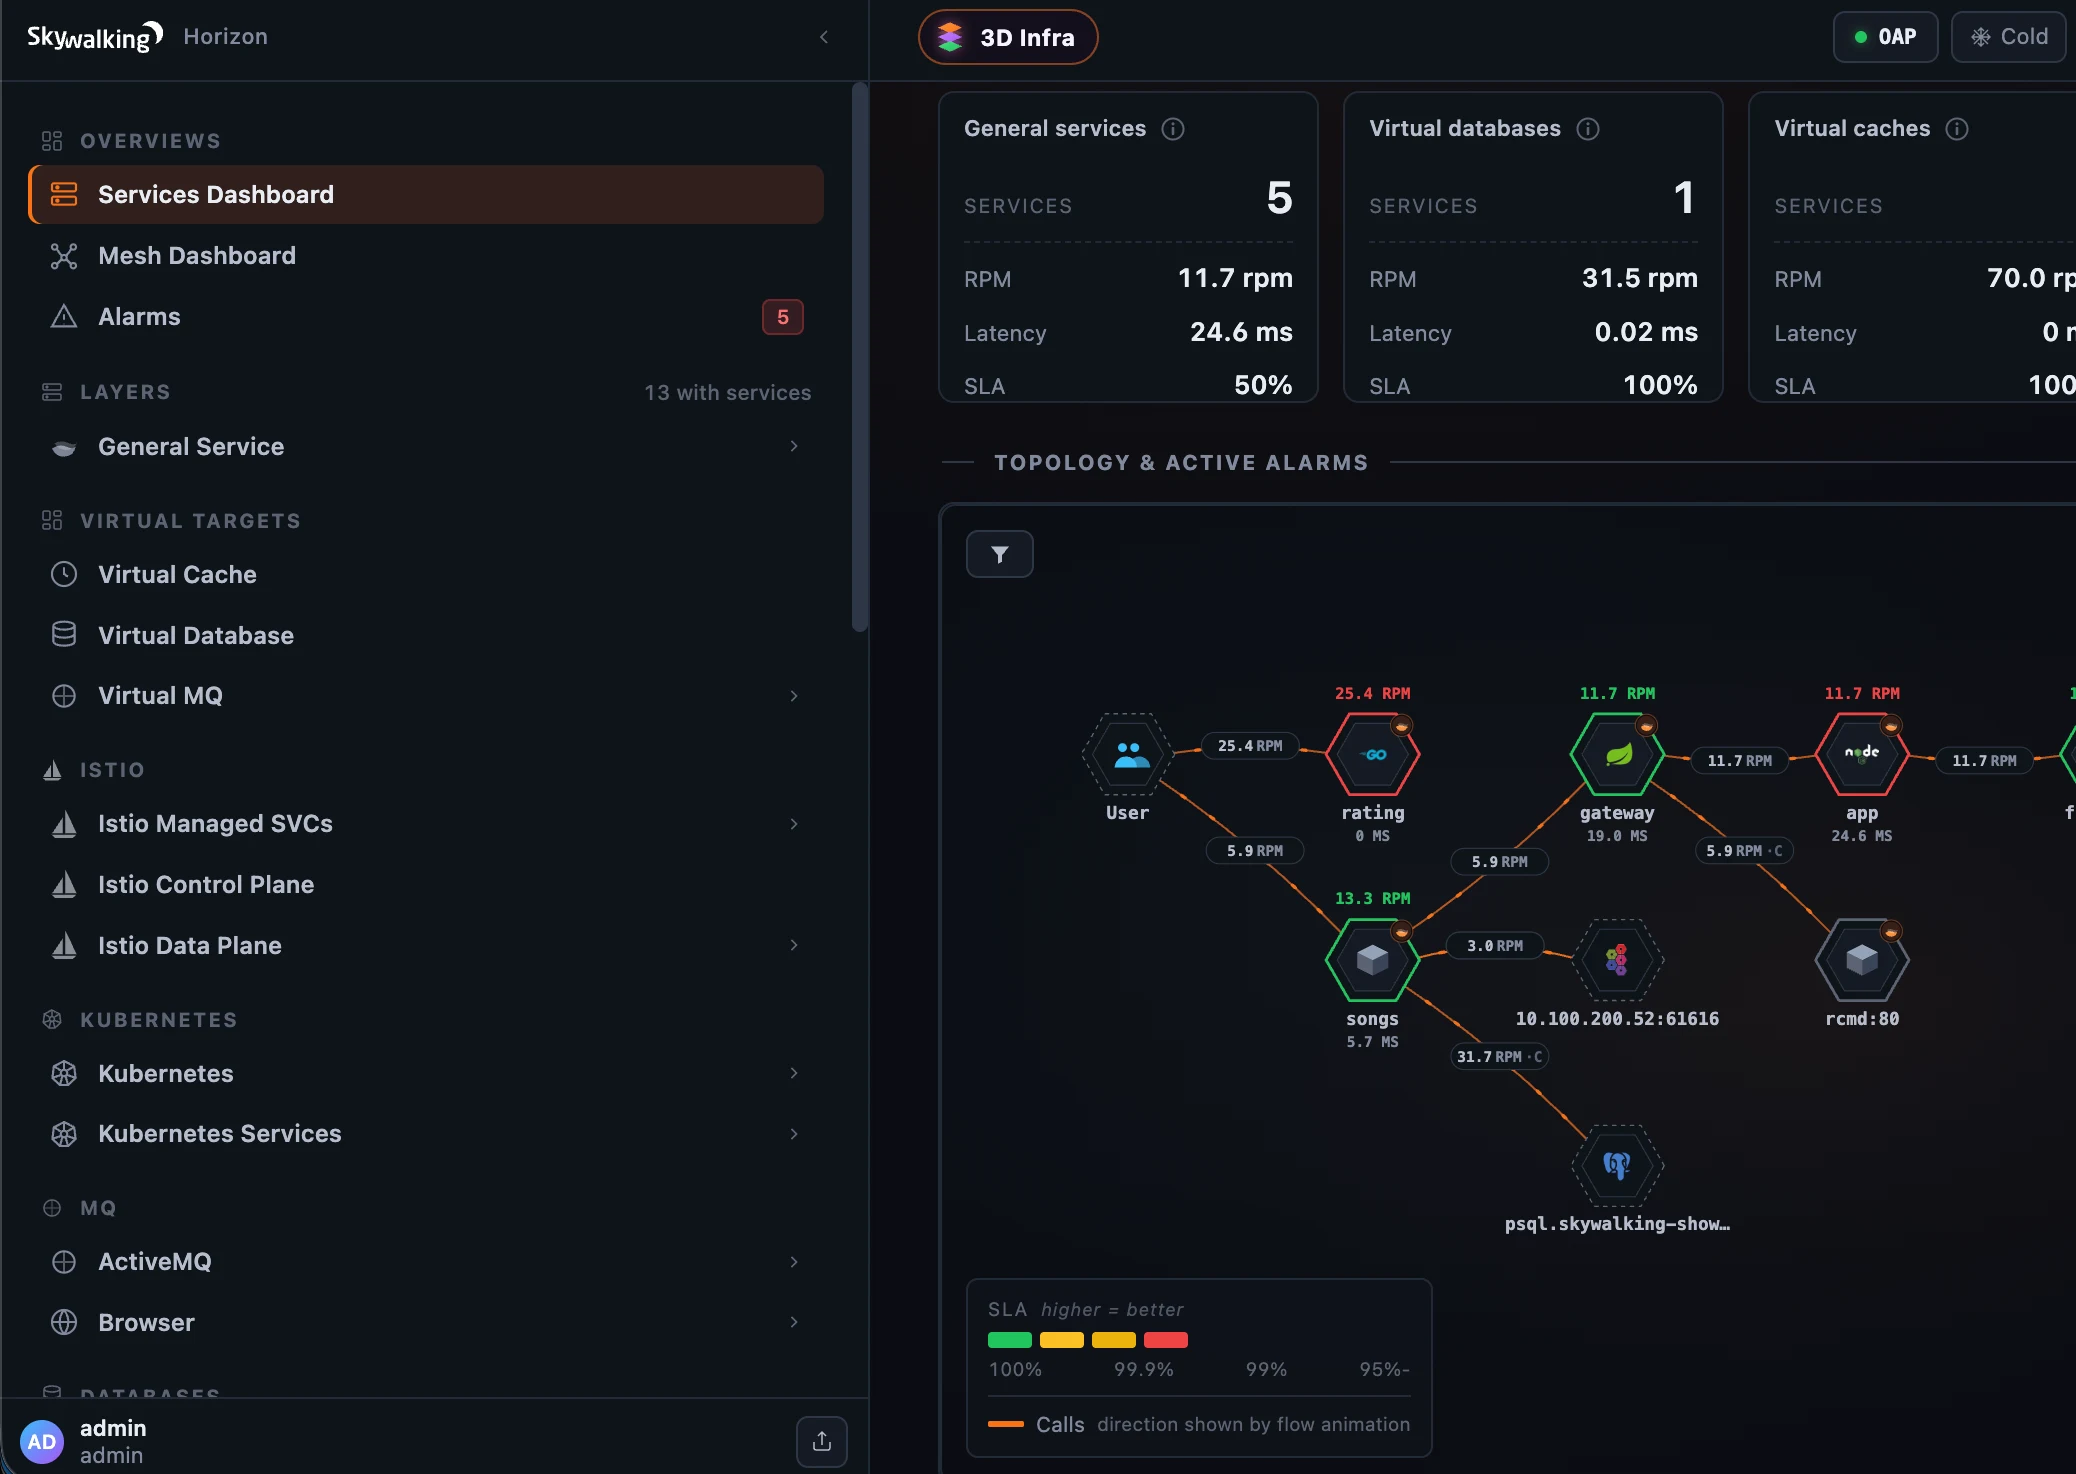 Figure 4: Drag the divider to widen the sidebar — long names stop truncating, and the width is remembered per browser.
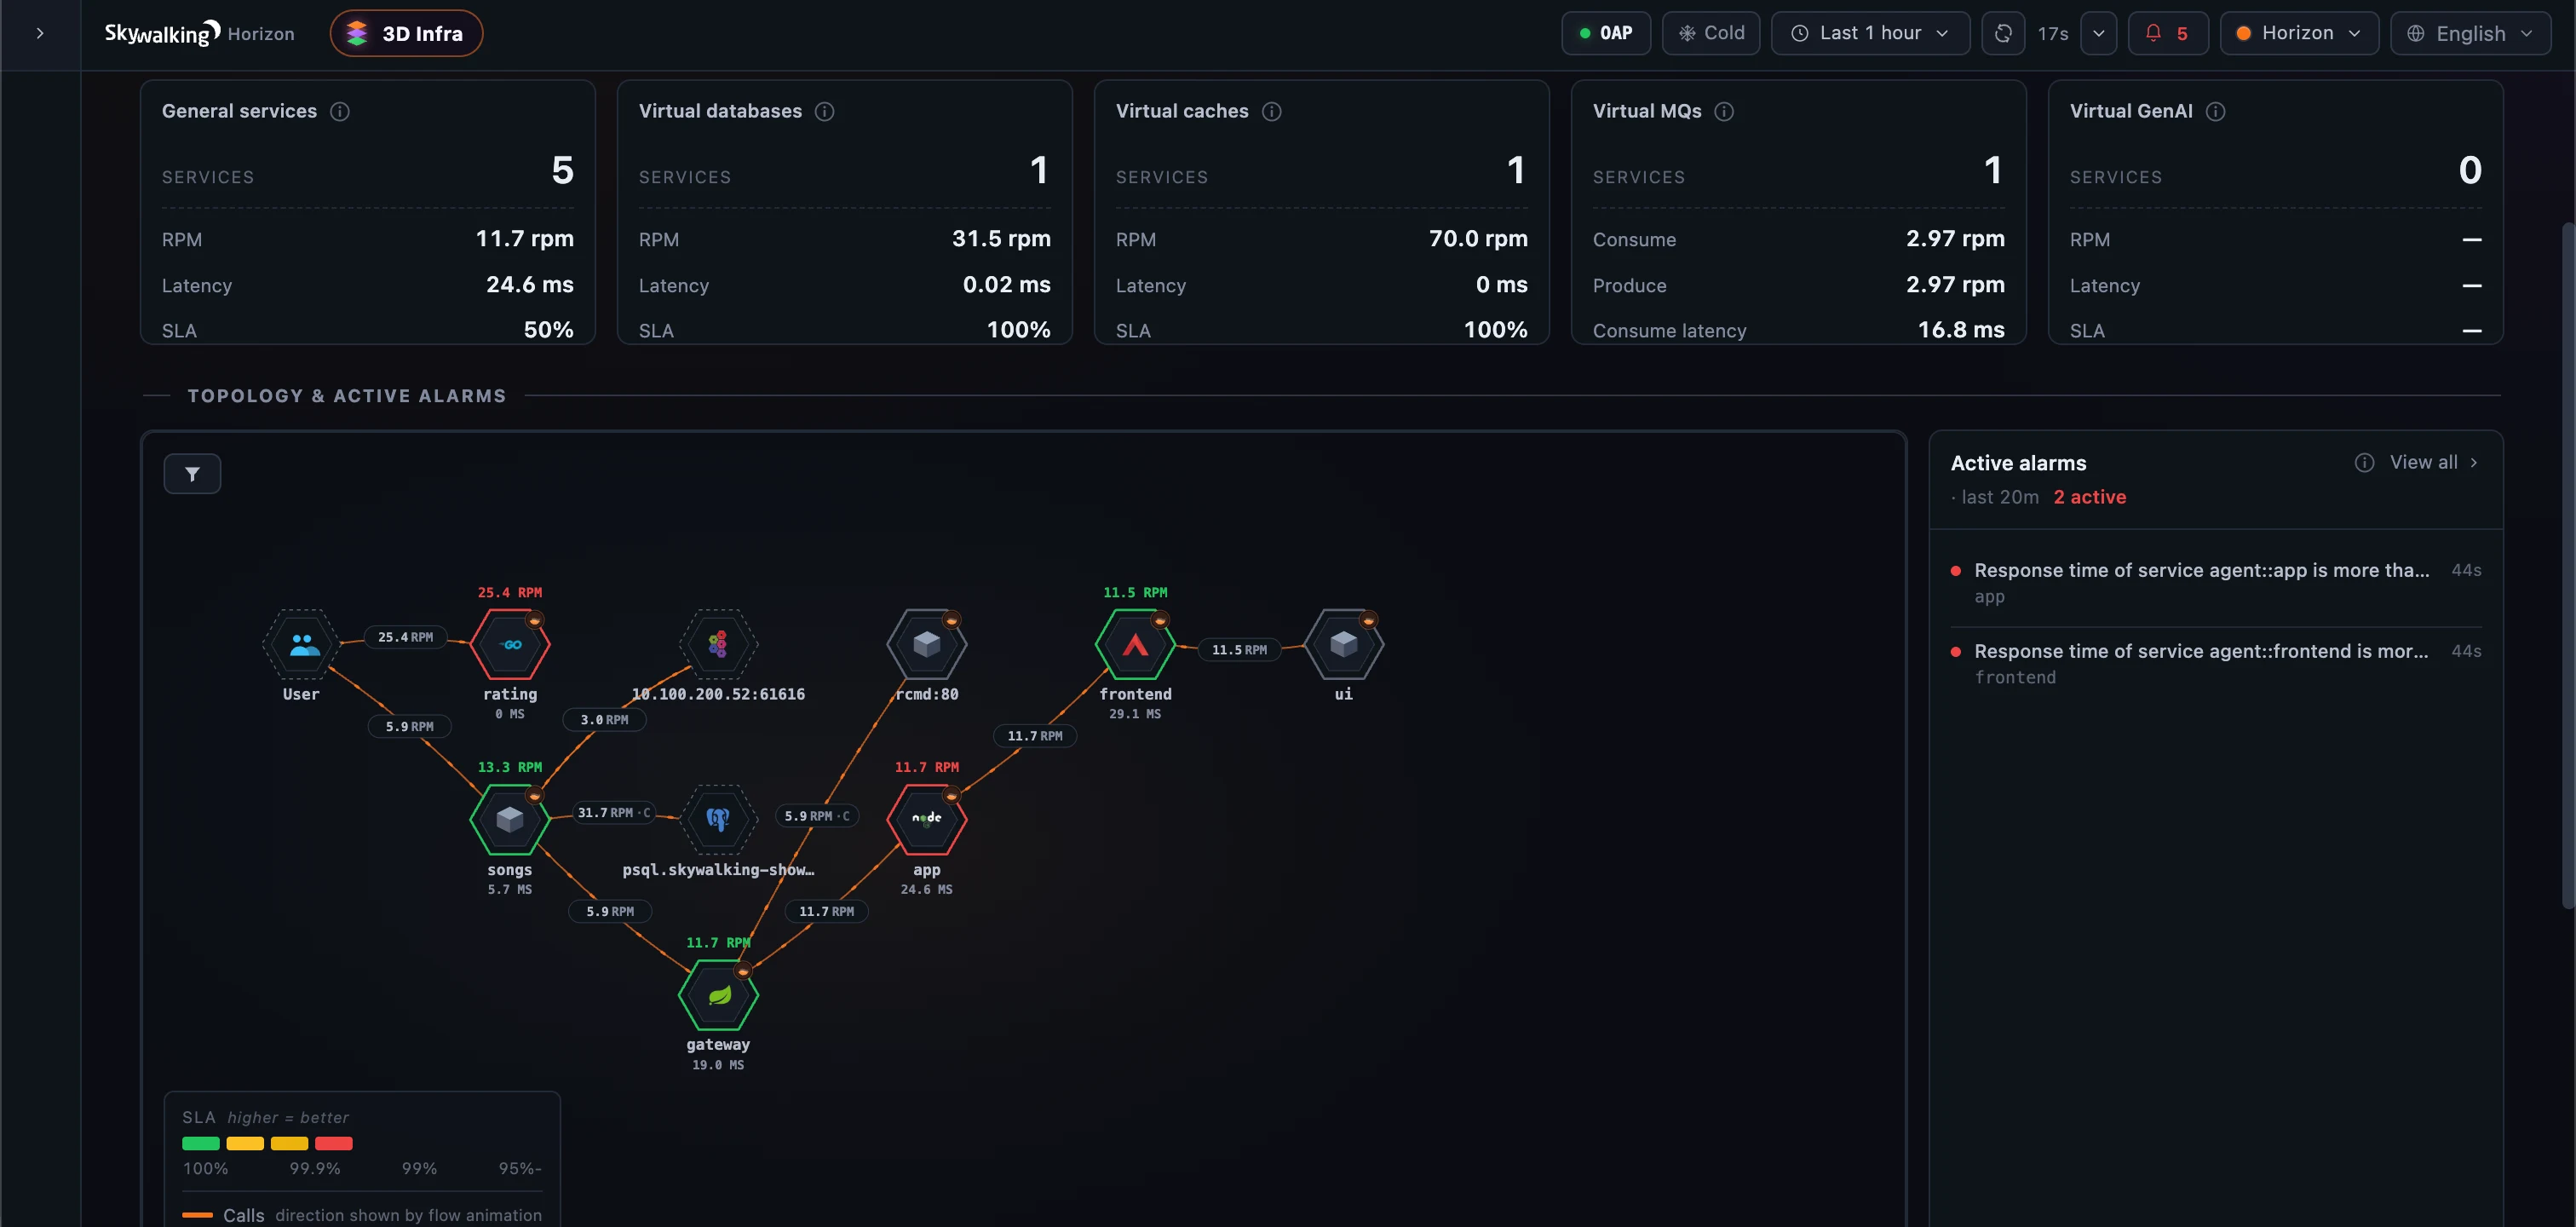 Figure 5: Fold the sidebar to a thin icon rail when you want the canvas to have every pixel.
One new tier makes the rest possible
Until now, SkyWalking’s web UI talked straight to OAP from the browser. Horizon introduces one small piece of infrastructure in between: a Backend-for-Frontend (BFF), a Fastify service on Node.js that serves the UI and proxies every call to OAP.
 The browser talks only to the BFF; the BFF owns auth, RBAC, audit, capability probing, and server-side i18n / widget gating, then proxies to OAP’s query host (
:12800) and admin host (:17128).
That tier is why the later posts in this series exist at all. Authentication, role-based access control, and the audit trail are enforced on the server, where a forged request can’t get past them. The BFF probes OAP’s GraphQL schema once at startup and degrades gracefully when a capability is missing — which is exactly how Horizon supports two OAP generations from one build (more on that below). It caches the service catalog once a minute so the whole UI shares one view of the estate. We’ll come back to each of these in the posts on operations, security, and customization; for now the thing to know is that there’s a server here now, and it’s doing real work.
A 3D look at the whole thing
One surface is worth previewing up front, because it captures the “stand back and look at everything at once” idea better than any screenshot can: the 3D Infrastructure Map. Every layer’s services become cubes, stacked onto tiers that read top-to-bottom the way a request flows, with live traffic, alarms, and call relationships drawn between them. Drag to orbit it:
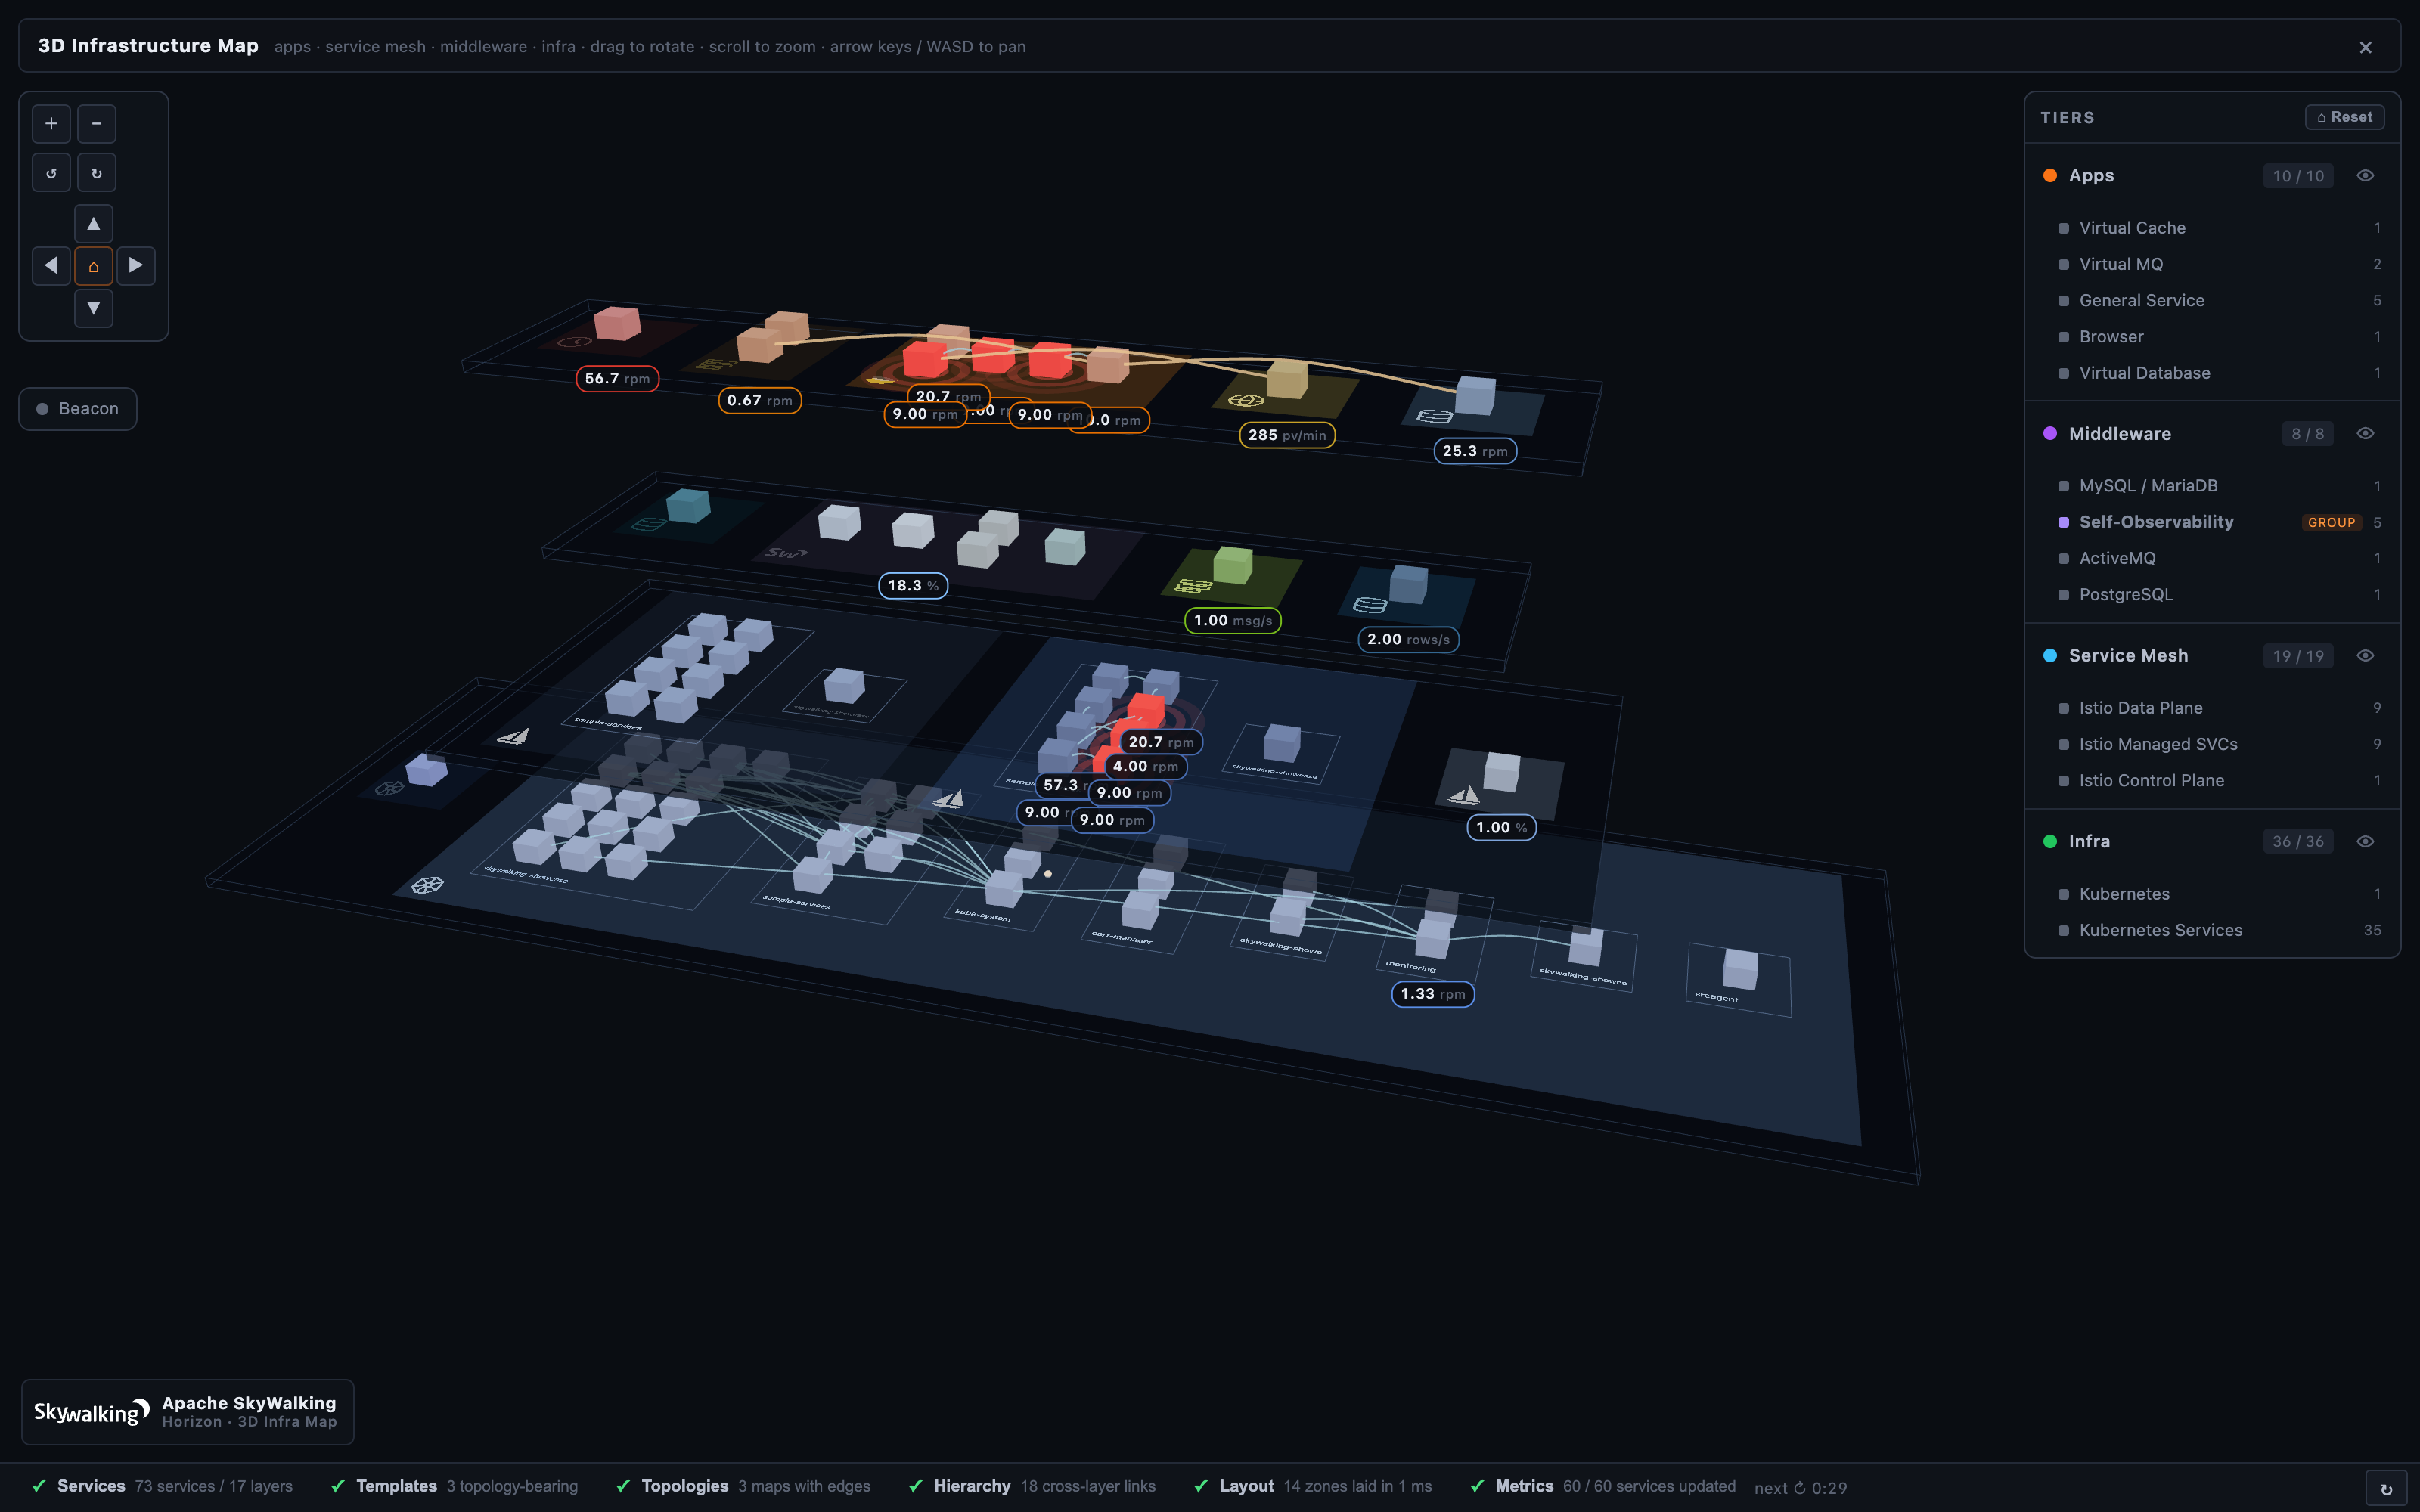
A dedicated post later in the series takes the 3D map apart properly — the tiers, the alarm beacons, “Beacon mode” that ghosts everything healthy so only what’s firing glows, and the structured editor that configures it. For now, it’s a fair picture of the ambition: your whole deployment, in one view, alive.
What’s in this series
Fifteen posts follow this one, each a standalone tour of one corner of Horizon — read them in any order; each links back here for the lay of the land. They fall into four arcs.
See your data
- Dashboards & MQE — widgets that query only what’s relevant to the entity in front of you, value formatting humans can read, synced crosshairs, and multi-entity compare.
- Topology & service dependency — one topology engine that repaints for every layer, the de-noising filter, and the multi-hop API-dependency graph.
- The Deployment tab & BanyanDB self-observability — a view that looks inside a single clustered service, and SkyWalking finally watching its own database the way it watches everything else.
- The 3D Infrastructure Map — the full treatment of the view above.
- Trace explorer — lasso the slow traces on a duration scatter, then read each one three ways.
- Log explorer — a Loki-style stream with facets, top patterns, and structured payloads.
- Browser & RUM monitoring — front-end error logs, and de-obfuscating a minified stack back to its original source line.
- Five profilers, one flame graph — trace, async-profiler, eBPF, Go pprof, and network profiling, unified behind one workflow.
Operate it
- Alarms & incident triage — incident-centric active alarms that ship the chart that fired them.
- Runtime rules, live debugging & inspect — hot-reloadable rules and a live debugger that steps OAL (traces), MAL (metrics), and LAL (logs) against live samples.
- Platform & cluster introspection — read the OAP cluster’s health, resolved config, and data retention from the UI.
Govern & secure it
- Access control & security — server-enforced RBAC, LDAP/AD, an audit trail, and break-glass — the capabilities that make the UI enterprise-deployable.
Make it yours, and adopt it
- Customization: config-driven layer templates — draft-to-publish, and adding a whole new monitored layer with zero UI code.
- Localization — every dashboard in eight languages, translated by clicking widgets in a live preview.
- Getting started & migration — install, the OAP version matrix, and swapping an existing UI for Horizon.
Try it against your OAP today
Horizon runs against the OAP you already have — and on today’s OAP 10.x nearly all of it works. Every dashboard, the topology, traces (native and Zipkin), logs, alarms, and all five profilers render off OAP’s query host (:12800), and Horizon’s access control, audit, and themes run in the BFF, independent of the OAP version. What waits for OAP 11.0 — the admin host (:17128) — is the operate layer: runtime-rule (DSL) management, the Live Debugger, Metrics Inspect, the alarm-rule editor, the Cluster Status admin pane, and publishing template edits back to OAP. Horizon detects each admin module by its presence and simply hides the pages 10.x can’t serve, so the full observability console runs on 10.x today and the operate tooling lights up the moment you move to 11.0.
Point Horizon at your existing cluster and bring it up — no backend changes, the same OAP your deployment already talks to:
docker run -d --name horizon \
  -p 8081:8081 \
  -v "$PWD/horizon.yaml:/app/horizon.yaml:ro" \
  -v horizon-state:/data \
  ghcr.io/apache/skywalking-horizon-ui:<version>
A minimal horizon.yaml is just where OAP lives and one local user to log in as:
oap:
  queryUrl: http://<oap-host>:12800
  adminUrl: http://<oap-host>:17128
auth:
  backend: local
  local:
    users:
      - username: admin
        passwordHash: "$argon2id$v=19$..."   # generated, never plaintext
        roles: [admin]
Open http://<host>:8081/, log in, and the first stop is Cluster Status to confirm Horizon and OAP are talking. From there, the sidebar fills in with your estate.
For the full setup path — binary tarball, Kubernetes, LDAP, TLS, and the production checklist — see the Horizon UI documentation, which covers setup, compatibility, access control, customization, components, and operations from its left-side menu.
Other notable points
- Drop-in against your existing OAP. Horizon is a greenfield rewrite that keeps every backend contract — the same GraphQL query protocol, admin REST surface, MQE language, and
Layerconcept — so you point it at a running cluster with no backend change. On today’s OAP 10.x the whole observability console works (dashboards, topology, traces including Zipkin, logs, alarms, profiling) along with Horizon’s BFF-side access control, audit, and themes; only the operate tooling — runtime rules, Live Debugger, Inspect, the Cluster Status admin pane, and publishing template edits — waits on OAP’s admin host (:17128), which ships with OAP 11.0. - Dark-first and dense. A 12-column grid built for incident scanning — more signal above the fold, less whitespace.
- Built on a modern stack. Vue 3 + TypeScript on Vite, Pinia, Apache ECharts, D3, and Monaco on the front end; Fastify on Node.js for the BFF.
- It’s Apache-licensed and community-built. Horizon UI lives at apache/skywalking-horizon-ui. Try it against your cluster, and tell us what’s missing — issues and pull requests are welcome.
Next up in the series: the dashboards — and why a widget can decide, on the server, that it shouldn’t even run its query for the entity you’re looking at.