使用 SkyWalking 监控 Nginx
背景介绍
在前面的 Blog 使用 LAL 收集并分析 Nginx access log 中,我们以 Nginx access log 为切入点, 演示了 SkyWalking LAL 的日志分析能力。
为了实现对 Nginx 更全面的监控能力,我们在 SkyWalking 9.7 中引入了 Nginx 监控面板,本文将演示该监控面板的使用,并介绍相关指标的含义。
监控面板接入
Metric 定义与采集
由于使用了 nginx-lua-prometheus 来定义及暴露指标, 我们需要为 Nginx 安装 lua_nginx_module, 或者直接使用OpenResty。
下面的例子中,我们通过 nginx-lua-prometheus 定义了四个指标,并通过 ip:9145/metrics 暴露指标接口:
- histogram: nginx_http_latency,监控 http 延时
- gauge: nginx_http_connections,监控 http 连接数
- counter: nginx_http_size_bytes,监控 http 请求和响应大小
- counter: nginx_http_requests_total,监控 http 请求次数
http {
    log_format  main  '$remote_addr - $remote_user [$time_local] "$request" '
                      '$status $body_bytes_sent "$http_referer" '
                      '"$http_user_agent" "$http_x_forwarded_for"';

    access_log  /var/log/nginx/access.log  main;

    lua_shared_dict prometheus_metrics 10M;
    # lua_package_path "/path/to/nginx-lua-prometheus/?.lua;;";

    init_worker_by_lua_block {
      prometheus = require("prometheus").init("prometheus_metrics")

      metric_bytes = prometheus:counter(
        "nginx_http_size_bytes", "Total size of HTTP", {"type", "route"})
      metric_requests = prometheus:counter(
        "nginx_http_requests_total", "Number of HTTP requests", {"status", "route"})
      metric_latency = prometheus:histogram(
        "nginx_http_latency", "HTTP request latency", {"route"})
      metric_connections = prometheus:gauge(
        "nginx_http_connections", "Number of HTTP connections", {"state"})
    }

    server {
        listen 8080;

        location /test {
          default_type application/json;
          return 200  '{"code": 200, "message": "success"}';

          log_by_lua_block {
            metric_bytes:inc(tonumber(ngx.var.request_length), {"request", "/test/**"})
            metric_bytes:inc(tonumber(ngx.var.bytes_send), {"response", "/test/**"})
            metric_requests:inc(1, {ngx.var.status, "/test/**"})
            metric_latency:observe(tonumber(ngx.var.request_time), {"/test/**"})
          }
        }
    }

    server {
      listen 9145;
      location /metrics {
        content_by_lua_block {
          metric_connections:set(ngx.var.connections_reading, {"reading"})
          metric_connections:set(ngx.var.connections_waiting, {"waiting"})
          metric_connections:set(ngx.var.connections_writing, {"writing"})
          prometheus:collect()
        }
      }
    }
}
上面的例子中,我们暴露了 route 级别的指标,你也可以根据监控粒度的需要,选择暴露 host 指标:
http {
  log_by_lua_block {
      metric_bytes:inc(tonumber(ngx.var.request_length), {"request", ngx.var.host})
      metric_bytes:inc(tonumber(ngx.var.bytes_send), {"response", ngx.var.host})
      metric_requests:inc(1, {ngx.var.status, ngx.var.host})
      metric_latency:observe(tonumber(ngx.var.request_time), {ngx.var.host})
  }
}
或者 upstream 指标:
upstream backend {
  server ip:port;
}

server {

  location /test_upstream {

    proxy_pass http://backend;

    log_by_lua_block {
      metric_bytes:inc(tonumber(ngx.var.request_length), {"request", "upstream/backend"})
      metric_bytes:inc(tonumber(ngx.var.bytes_send), {"response", "upstream/backend"})
      metric_requests:inc(1, {ngx.var.status, "upstream/backend"})
      metric_latency:observe(tonumber(ngx.var.request_time), {"upstream/backend"})
    }
  }
}
完成指标定义后,我们启动 nginx 和 opentelemetry-collector,将指标采集到 SkyWalking 后端进行分析和存储。
请确保job_name: 'nginx-monitoring',否则上报的数据将被 SkyWalking 忽略。如果你有多个 Nginx 实例,你可以通过service及service_instance_id这两个 label 进行区分:
receivers:
  prometheus:
    config:
      scrape_configs:
        - job_name: 'nginx-monitoring'
          scrape_interval: 5s
          metrics_path: "/metrics"
          static_configs:
            - targets: ['nginx:9145']
              labels:
                service: nginx
                service_instance_id: nginx-instance
processors:
  batch:

exporters:
  otlp:
    endpoint: oap:11800
    tls:
      insecure: true
service:
  pipelines:
    metrics:
      receivers:
        - prometheus
      processors:
        - batch
      exporters:
        - otlp
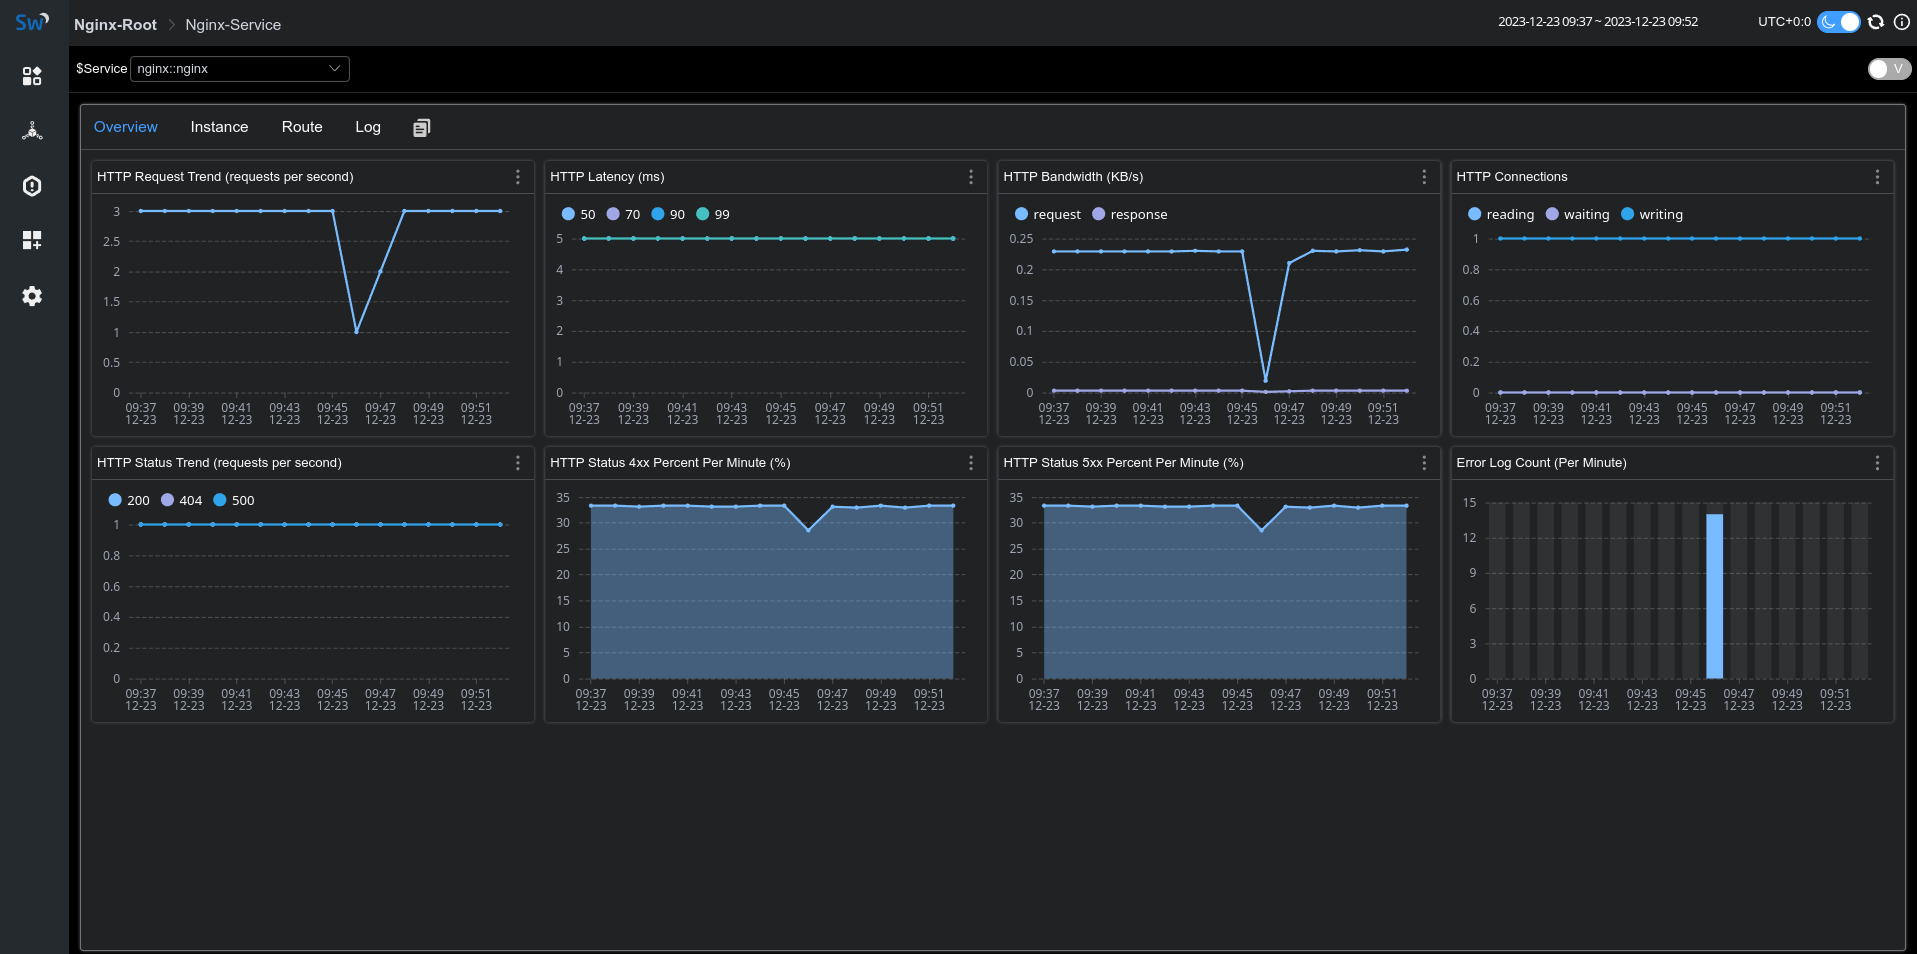
如果一切顺利,你将在 skywalking-ui 的网关菜单下看到 nginx 上报的指标数据:
Access & Error Log 采集
SkyWalking Nginx 监控提供了日志采集及错误日志统计功能,我们可以借助 fluent-bit 采集并上报 access log、error log 给 SkyWalking 分析存储。
下面 fluent-bit 配置定义了日志采集目录为/var/log/nginx/,access 和 error log 经过 rewrite_access_log 和 rewrite_error_log 处理后会通过 oap 12800 端口进行上报:
[SERVICE]
    Flush          5
    Daemon         Off
    Log_Level      warn
[INPUT]
    Name           tail
    Tag            access
    Path           /var/log/nginx/access.log
[INPUT]
    Name           tail
    Tag            error
    Path           /var/log/nginx/error.log
[FILTER]
    Name           lua
    Match          access
    Script         fluent-bit-script.lua
    Call           rewrite_access_log
[FILTER]
    Name           lua
    Match          error
    Script         fluent-bit-script.lua
    Call           rewrite_error_log
[OUTPUT]
    Name            stdout
    Match           *
    Format          json
[OUTPUT]
    Name            http
    Match           *
    Host            oap
    Port            12800
    URI             /v3/logs
    Format          json
在 fluent-bit-script.lua 中,我们通过 LOG_KIND 来区分 access log 和 error log。
为了能够关联上文采集的 metric,请确保 service 和 serviceInstance 值与上文中指标采集定义一致。
function rewrite_access_log(tag, timestamp, record)
    local newRecord = {}
    newRecord["layer"] = "NGINX"
    newRecord["service"] = "nginx::nginx"
    newRecord["serviceInstance"] = "nginx-instance"
    newRecord["body"] = { text = { text = record.log } }
    newRecord["tags"] = { data = {{ key = "LOG_KIND", value = "NGINX_ACCESS_LOG"}}}
    return 1, timestamp, newRecord
end

function rewrite_error_log(tag, timestamp, record)
    local newRecord = {}
    newRecord["layer"] = "NGINX"
    newRecord["service"] = "nginx::nginx"
    newRecord["serviceInstance"] = "nginx-instance"
    newRecord["body"] = { text = { text = record.log } }
    newRecord["tags"] = { data = {{ key = "LOG_KIND", value = "NGINX_ERROR_LOG" }}}
    return 1, timestamp, newRecord
end
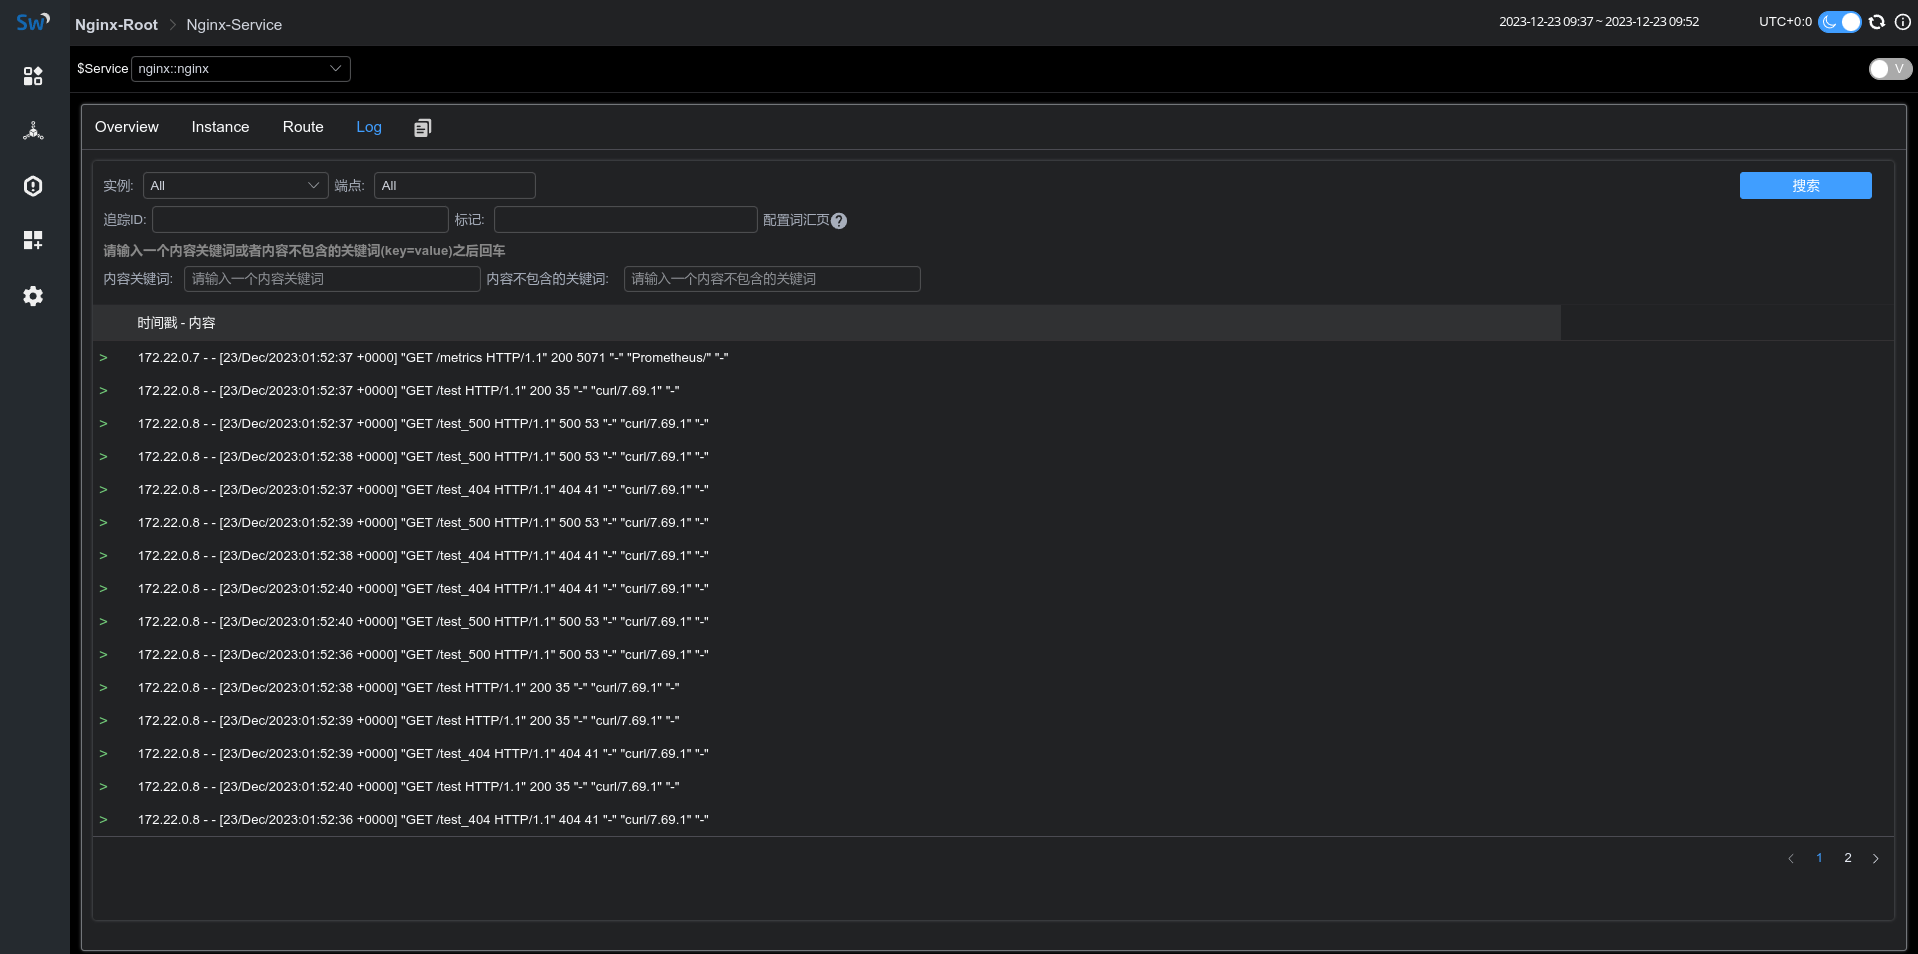
启动 fluent-it 后,我们便可以在监控面板的 Log tab 看到采集到的日志信息:
面板指标含义
| 面板名称 | 单位 | 指标含义 | 数据源 |
|---|---|---|---|
| HTTP Request Trend | 每秒钟平均请求数 | nginx-lua-prometheus | |
| HTTP Latency | ms | 平均响应延时 | nginx-lua-prometheus |
| HTTP Bandwidth | KB | 请求响应流量 | nginx-lua-prometheus |
| HTTP Connections | nginx http 连接数 | nginx-lua-prometheus | |
| HTTP Status Trend | % | 每分钟 http 状态码统计 | nginx-lua-prometheus |
| HTTP Status 4xx Percent | % | 4xx状态码比例 | nginx-lua-prometheus |
| HTTP Status 5xx Percent | % | 5xx状态码比例 | nginx-lua-prometheus |
| Error Log Count | 每分钟错误日志数统计 | fluent-bit |