Pinpoint Service Mesh Critical Performance Impact by using eBPF
Content
Background
Apache SkyWalking observes metrics, logs, traces, and events for services deployed into the service mesh. When troubleshooting, SkyWalking error analysis can be an invaluable tool helping to pinpoint where an error occurred. However, performance problems are more difficult: It’s often impossible to locate the root cause of performance problems with pre-existing observation data. To move beyond the status quo, dynamic debugging and troubleshooting are essential service performance tools. In this article, we’ll discuss how to use eBPF technology to improve the profiling feature in SkyWalking and analyze the performance impact in the service mesh.
Trace Profiling in SkyWalking
Since SkyWalking 7.0.0, Trace Profiling has helped developers find performance problems by periodically sampling the thread stack to let developers know which lines of code take more time. However, Trace Profiling is not suitable for the following scenarios:
- Thread Model: Trace Profiling is most useful for profiling code that executes in a single thread. It is less useful for middleware that relies heavily on async execution models. For example Goroutines in Go or Kotlin Coroutines.
- Language: Currently, Trace Profiling is only supported in Java and Python, since it’s not easy to obtain the thread stack in the runtimes of some languages such as Go and Node.js.
- Agent Binding: Trace Profiling requires Agent installation, which can be tricky depending on the language (e.g., PHP has to rely on its C kernel; Rust and C/C++ require manual instrumentation to make install).
- Trace Correlation: Since Trace Profiling is only associated with a single request it can be hard to determine which request is causing the problem.
- Short Lifecycle Services: Trace Profiling doesn’t support short-lived services for (at least) two reasons:
- It’s hard to differentiate system performance from class code manipulation in the booting stage.
- Trace profiling is linked to an endpoint to identify performance impact, but there is no endpoint to match these short-lived services.
Fortunately, there are techniques that can go further than Trace Profiling in these situations.
Introduce eBPF
We have found that eBPF — a technology that can run sandboxed programs in an operating system kernel and thus safely and efficiently extend the capabilities of the kernel without requiring kernel modifications or loading kernel modules — can help us fill gaps left by Trace Profiling. eBPF is a trending technology because it breaks the traditional barrier between user and kernel space. Programs can now inject bytecode that runs in the kernel, instead of having to recompile the kernel to customize it. This is naturally a good fit for observability.
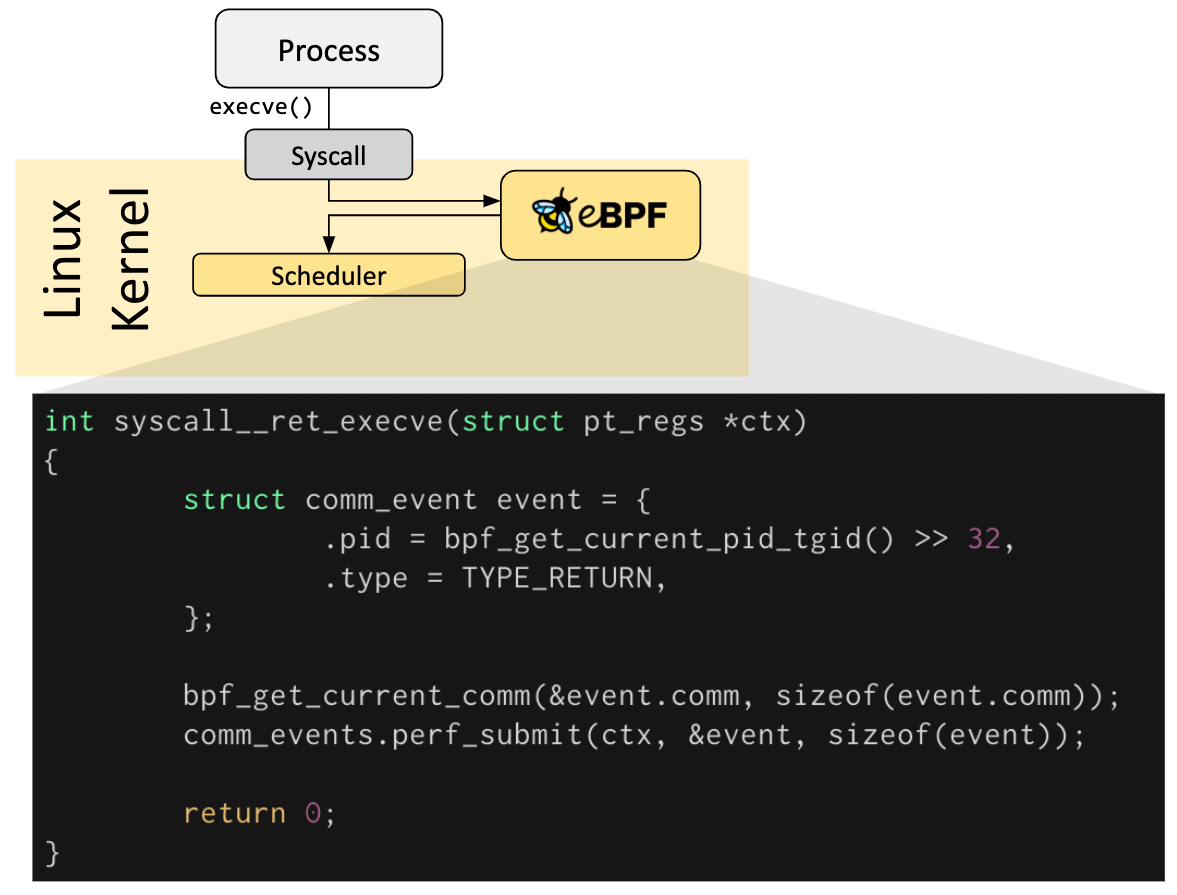
In the figure below, we can see that when the system executes the execve syscalls, the eBPF program is triggered, and the current process runtime information is obtained by using function calls.
Using eBPF technology, we can expand the scope of Skywalking’s profiling capabilities:
- Global Performance Analysis: Before eBPF, data collection was limited to what agents can observe. Since eBPF programs run in the kernel, they can observe all threads. This is especially useful when you are not sure whether a performance problem is caused by a particular request.
- Data Content: eBPF can dump both user and kernel space thread stacks, so if a performance issue happens in kernel space, it’s easier to find.
- Agent Binding: All modern Linux kernels support eBPF, so there is no need to install anything. This means it is an orchestration-free vs an agent model. This reduces friction caused by built-in software which may not have the correct agents installed, such as Envoy in a Service Mesh.
- Sampling Type: Unlike Trace Profiling, eBPF is event-driven and, therefore, not constrained by interval polling. For example, eBPF can trigger events and collect more data depending on a transfer size threshold. This can allow the system to triage and prioritize data collection under extreme load.
eBPF Limitations
While eBPF offers significant advantages for hunting performance bottlenecks, no technology is perfect. eBPF has a number of limitations described below. Fortunately, since SkyWalking does not require eBPF, the impact is limited.
- Linux Version Requirement: eBPF programs require a Linux kernel version above 4.4, with later kernel versions offering more data to be collected. The BCC has documented the features supported by different Linux kernel versions, with the differences between versions usually being what data can be collected with eBPF.
- Privileges Required: All processes that intend to load eBPF programs into the Linux kernel must be running in privileged mode. As such, bugs or other issues in such code may have a big impact.
- Weak Support for Dynamic Language: eBPF has weak support for JIT-based dynamic languages, such as Java. It also depends on what data you want to collect. For Profiling, eBPF does not support parsing the symbols of the program, which is why most eBPF-based profiling technologies only support static languages like C, C++, Go, and Rust. However, symbol mapping can sometimes be solved through tools provided by the language. For example, in Java, perf-map-agent can be used to generate the symbol mapping. However, dynamic languages don’t support the attach (uprobe) functionality that would allow us to trace execution events through symbols.
Introducing SkyWalking Rover
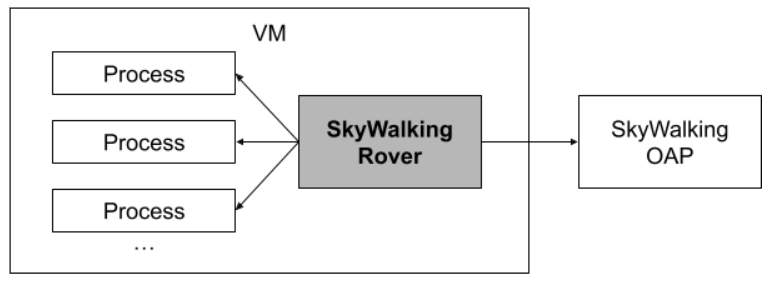
SkyWalking Rover introduces the eBPF profiling feature into the SkyWalking ecosystem. The figure below shows the overall architecture of SkyWalking Rover. SkyWalking Rover is currently supported in Kubernetes environments and must be deployed inside a Kubernetes cluster. After establishing a connection with the SkyWalking backend server, it saves information about the processes on the current machine to SkyWalking. When the user creates an eBPF profiling task via the user interface, SkyWalking Rover receives the task and executes it in the relevant C, C++, Golang, and Rust language-based programs.
Other than an eBPF-capable kernel, there are no additional prerequisites for deploying SkyWalking Rover.
CPU Profiling with Rover
CPU profiling is the most intuitive way to show service performance. Inspired by Brendan Gregg‘s blog post, we’ve divided CPU profiling into two types that we have implemented in Rover:
- On-CPU Profiling: Where threads are spending time running on-CPU.
- Off-CPU Profiling: Where time is spent waiting while blocked on I/O, locks, timers, paging/swapping, etc.
Profiling Envoy with eBPF
Envoy is a popular proxy, used as the data plane by the Istio service mesh. In a Kubernetes cluster, Istio injects Envoy into each service’s pod as a sidecar where it transparently intercepts and processes incoming and outgoing traffic. As the data plane, any performance issues in Envoy can affect all service traffic in the mesh. In this scenario, it’s more powerful to use eBPF profiling to analyze issues in production caused by service mesh configuration.
Demo Environment
If you want to see this scenario in action, we’ve built a demo environment where we deploy an Nginx service for stress testing. Traffic is intercepted by Envoy and forwarded to Nginx. The commands to install the whole environment can be accessed through GitHub.
On-CPU Profiling
On-CPU profiling is suitable for analyzing thread stacks when service CPU usage is high. If the stack is dumped more times, it means that the thread stack occupies more CPU resources.
When installing Istio using the demo configuration profile, we found there are two places where we can optimize performance:
- Zipkin Tracing: Different Zipkin sampling percentages have a direct impact on QPS.
- Access Log Format: Reducing the fields of the Envoy access log can improve QPS.
Zipkin Tracing
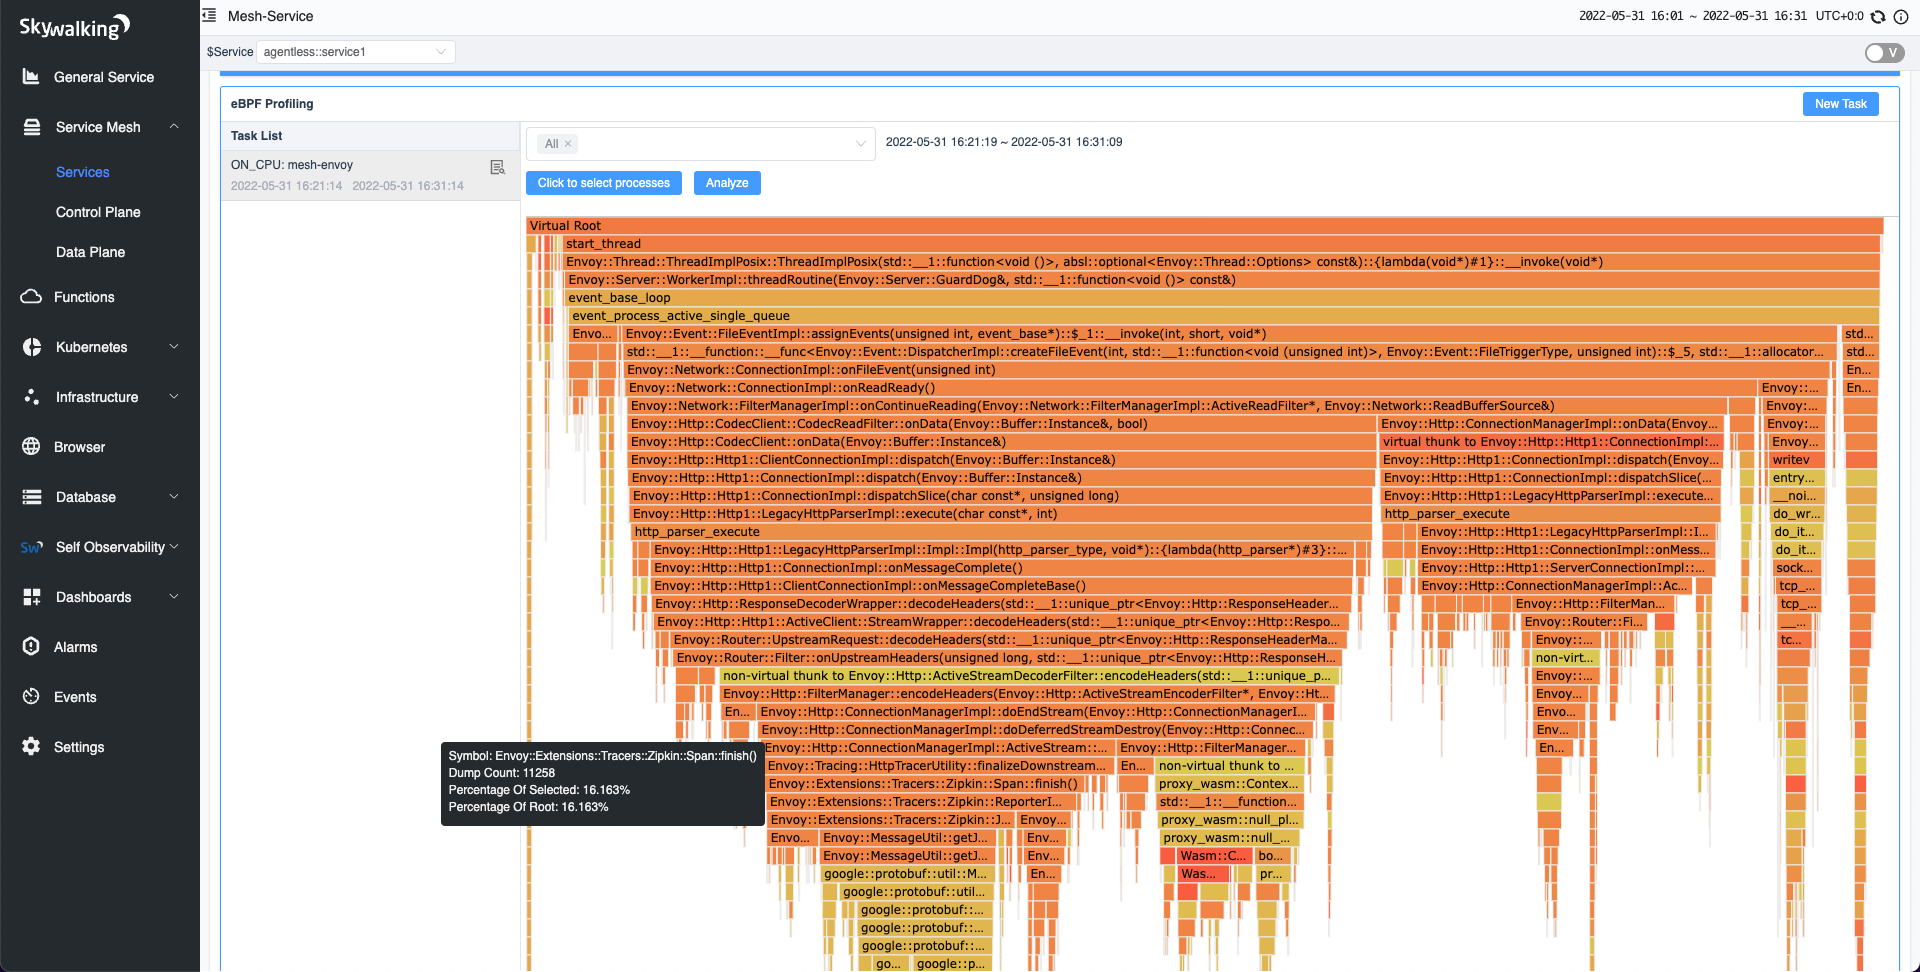
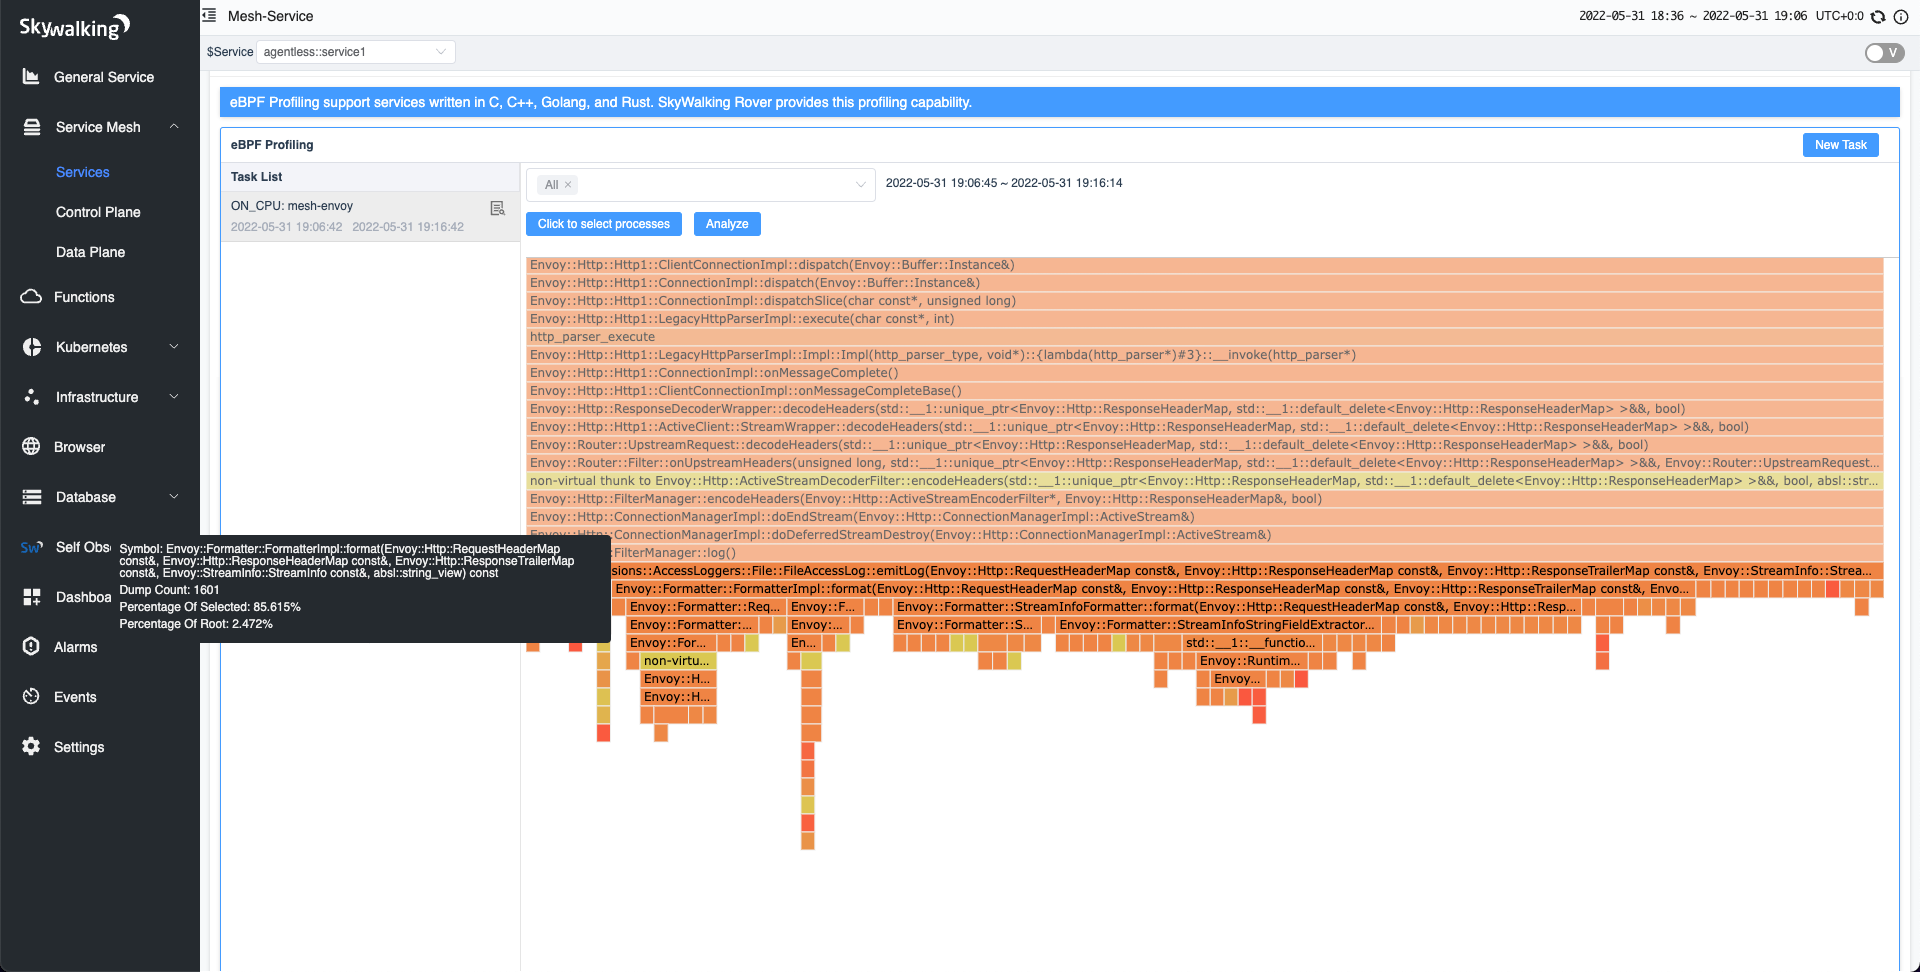
Zipkin with 100% sampling
In the default demo configuration profile, Envoy is using 100% sampling as default tracing policy. How does that impact the performance?
As shown in the figure below, using the on-CPU profiling, we found that it takes about 16% of the CPU overhead. At a fixed consumption of 2 CPUs, its QPS can reach 5.7K.
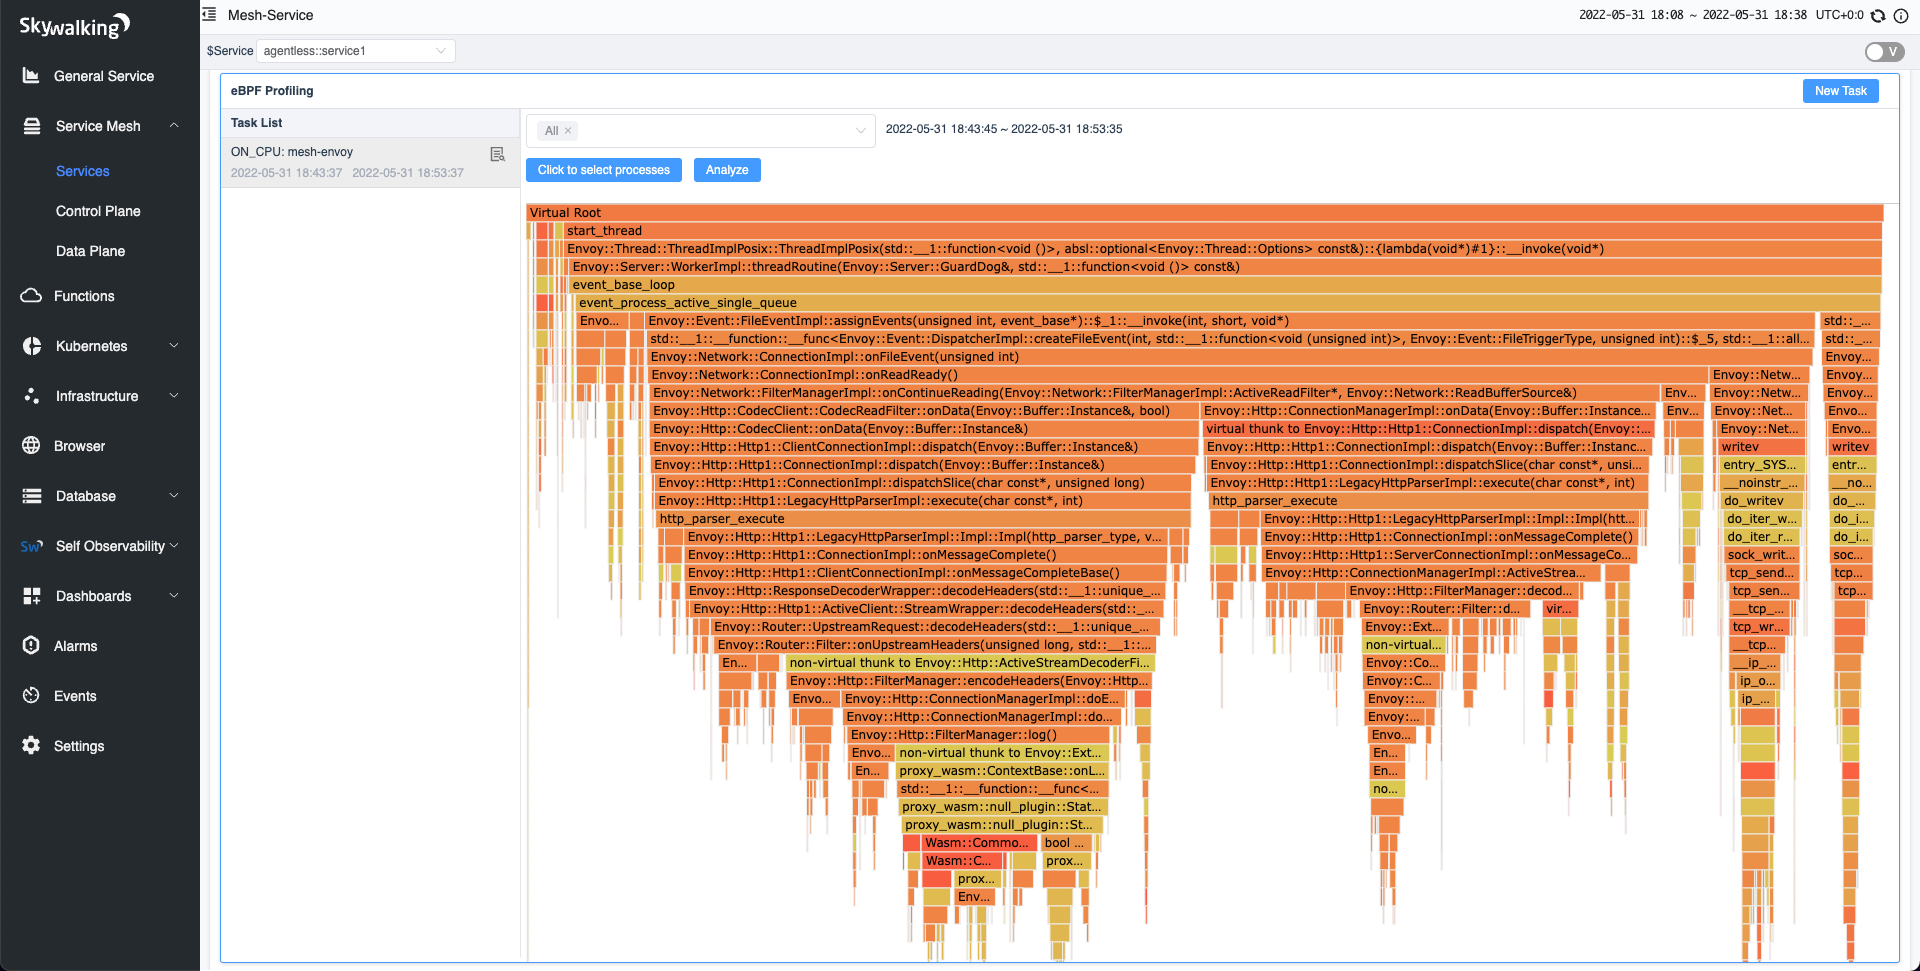
Disable Zipkin tracing
At this point, we found that if Zipkin is not necessary, the sampling percentage can be reduced or we can even disable tracing. Based on the Istio documentation, we can disable tracing when installing the service mesh using the following command:
istioctl install -y --set profile=demo \
   --set 'meshConfig.enableTracing=false' \
   --set 'meshConfig.defaultConfig.tracing.sampling=0.0'
After disabling tracing, we performed on-CPU profiling again. According to the figure below, we found that Zipkin has disappeared from the flame graph. With the same 2 CPU consumption as in the previous example, the QPS reached 9K, which is an almost 60% increase.
Tracing with Throughput
With the same CPU usage, we’ve discovered that Envoy performance greatly improves when the tracing feature is disabled. Of course, this requires us to make trade-offs between the number of samples Zipkin collects and the desired performance of Envoy (QPS).
The table below illustrates how different Zipkin sampling percentages under the same CPU usage affect QPS.
| Zipkin sampling % | QPS | CPUs | Note |
|---|---|---|---|
| 100% (default) | 5.7K | 2 | 16% used by Zipkin |
| 1% | 8.1K | 2 | 0.3% used by Zipkin |
| disabled | 9.2K | 2 | 0% used by Zipkin |
Access Log Format
Default Log Format
In the default demo configuration profile, the default Access Log format contains a lot of data. The flame graph below shows various functions involved in parsing the data such as request headers, response headers, and streaming the body.
Simplifying Access Log Format
Typically, we don’t need all the information in the access log, so we can often simplify it to get what we need. The following command simplifies the access log format to only display basic information:
istioctl install -y --set profile=demo \
   --set meshConfig.accessLogFormat="[%START_TIME%] \"%REQ(:METHOD)% %REQ(X-ENVOY-ORIGINAL-PATH?:PATH)% %PROTOCOL%\" %RESPONSE_CODE%\n"
After simplifying the access log format, we found that the QPS increased from 5.7K to 5.9K. When executing the on-CPU profiling again, the CPU usage of log formatting dropped from 2.4% to 0.7%.
Simplifying the log format helped us to improve the performance.
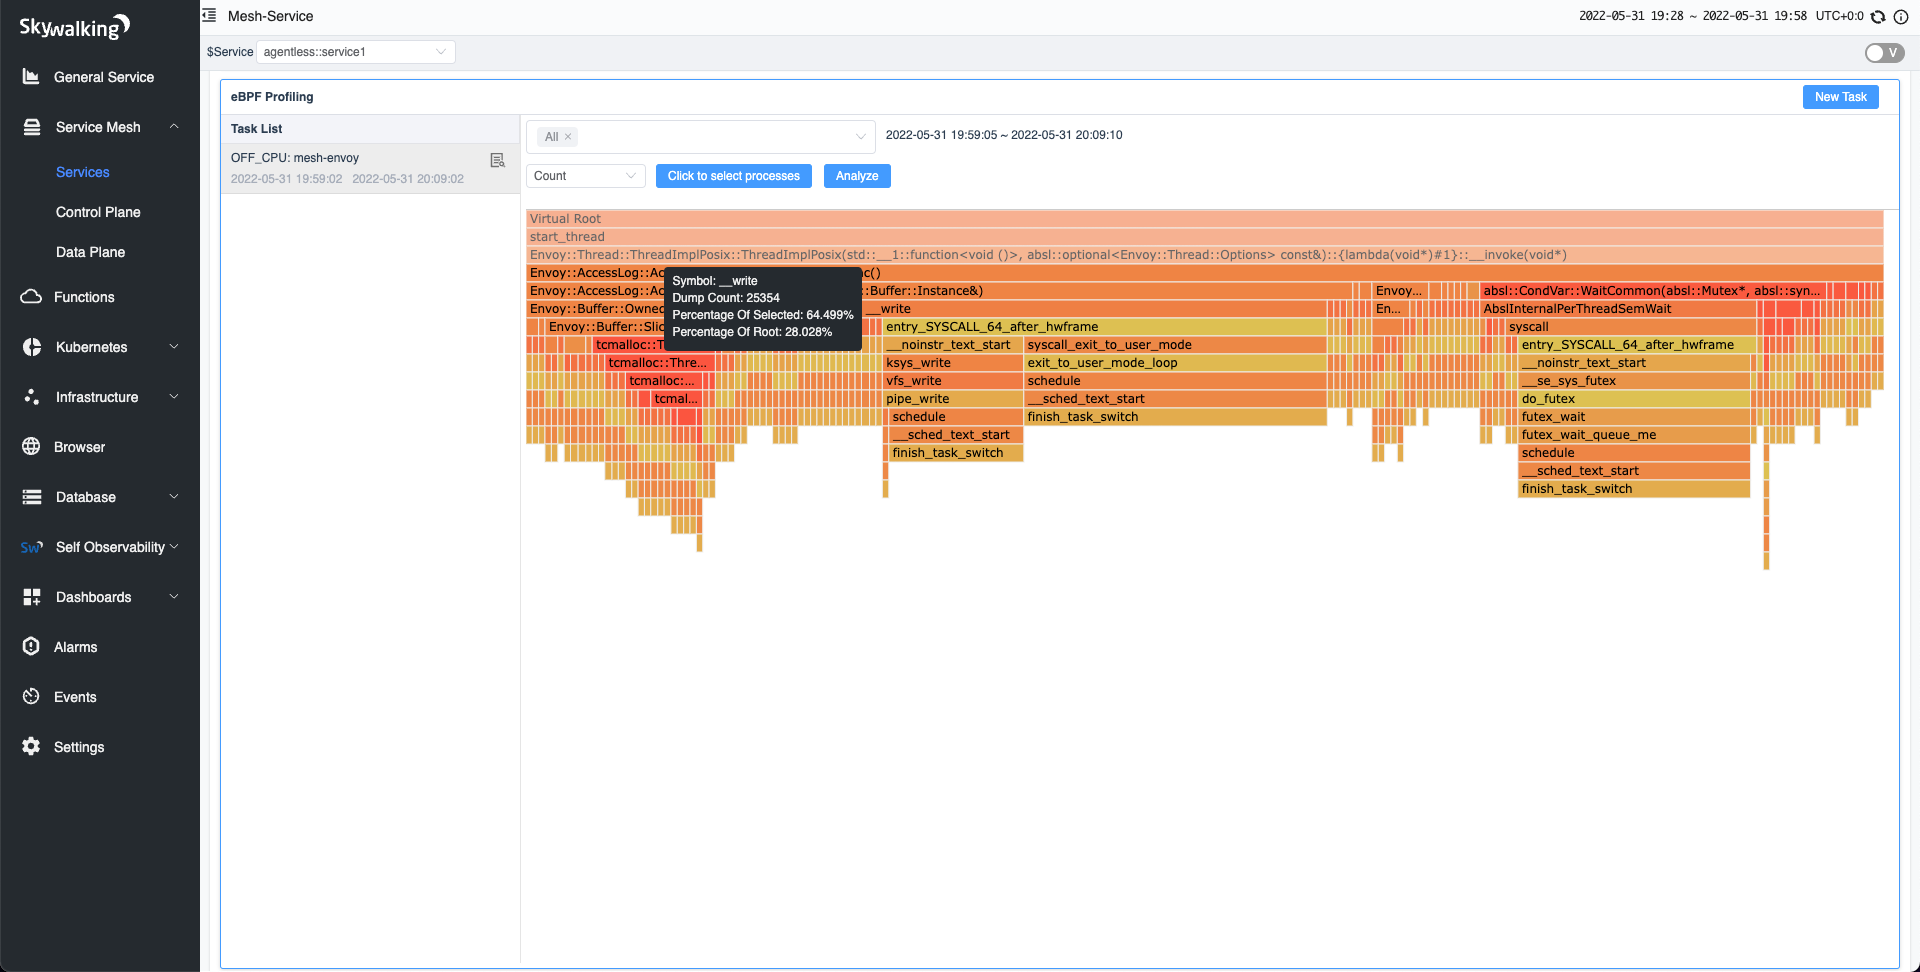
Off-CPU Profiling
Off-CPU profiling is suitable for performance issues that are not caused by high CPU usage. For example, when there are too many threads in one service, using off-CPU profiling could reveal which threads spend more time context switching.
We provide data aggregation in two dimensions:
- Switch count: The number of times a thread switches context. When the thread returns to the CPU, it completes one context switch. A thread stack with a higher switch count spends more time context switching.
- Switch duration: The time it takes a thread to switch the context. A thread stack with a higher switch duration spends more time off-CPU.
Write Access Log
Enable Write
Using the same environment and settings as before in the on-CPU test, we performed off-CPU profiling. As shown below, we found that access log writes accounted for about 28% of the total context switches. The “__write” shown below also indicates that this method is the Linux kernel method.
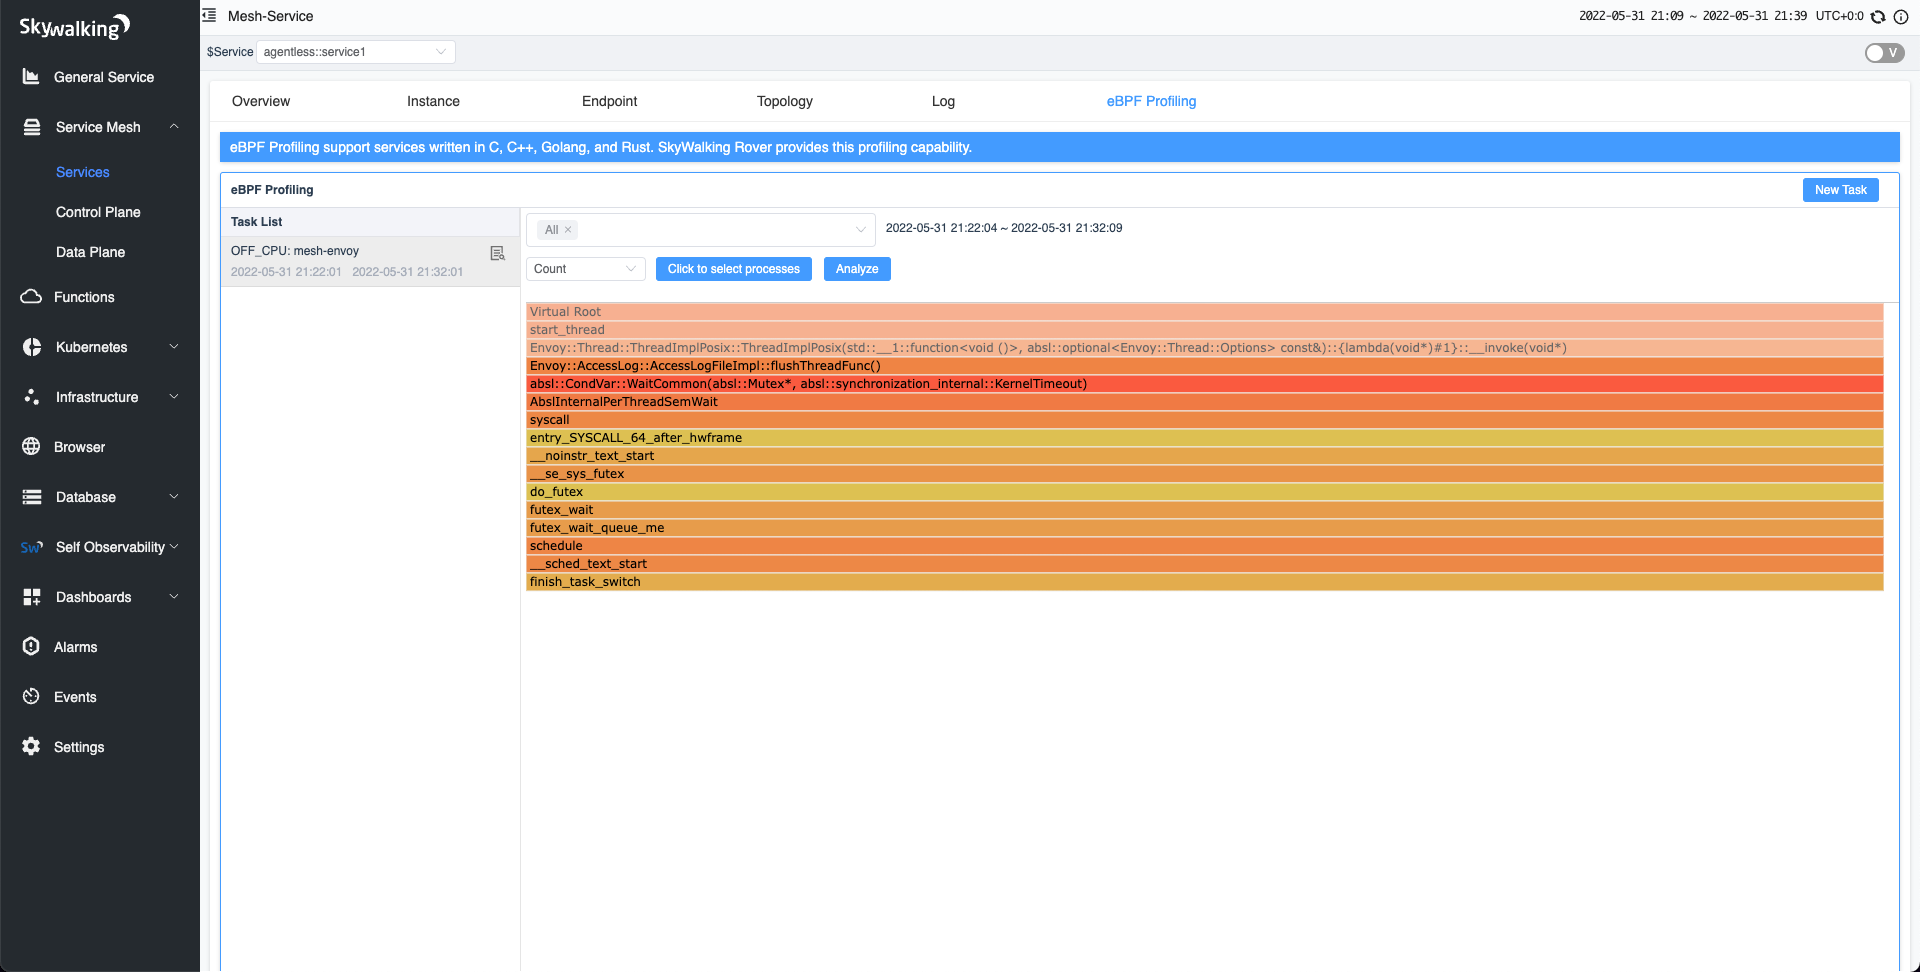
Disable Write
SkyWalking implements Envoy’s Access Log Service (ALS) feature which allows us to send access logs to the SkyWalking Observability Analysis Platform (OAP) using the gRPC protocol. Even by disabling the access logging, we can still use ALS to capture/aggregate the logs. We’ve disabled writing to the access log using the following command:
istioctl install -y --set profile=demo --set meshConfig.accessLogFile=""
After disabling the Access Log feature, we performed the off-CPU profiling. File writing entries have disappeared as shown in the figure below. Envoy throughput also increased from 5.7K to 5.9K.
Conclusion
In this article, we’ve examined the insights Apache Skywalking’s Trace Profiling can give us and how much more can be achieved with eBPF profiling. All of these features are implemented in skywalking-rover. In addition to on- and off-CPU profiling, you will also find the following features:
- Continuous profiling, helps you automatically profile without manual intervention. For example, when Rover detects that the CPU exceeds a configurable threshold, it automatically executes the on-CPU profiling task.
- More profiling types to enrich usage scenarios, such as network, and memory profiling.