SkyWalking performance in Service Mesh scenario
Service mesh receiver was first introduced in Apache SkyWalking 6.0.0-beta. It is designed to provide a common entrance for receiving telemetry data from service mesh framework, for instance, Istio, Linkerd, Envoy etc. What’s the service mesh? According to Istio’s explain:
The term service mesh is used to describe the network of microservices that make up such applications and the interactions between them.
As a PMC member of Apache SkyWalking, I tested trace receiver and well understood the performance of collectors in trace scenario. I also would like to figure out the performance of service mesh receiver.
Different between trace and service mesh
Following chart presents a typical trace map:
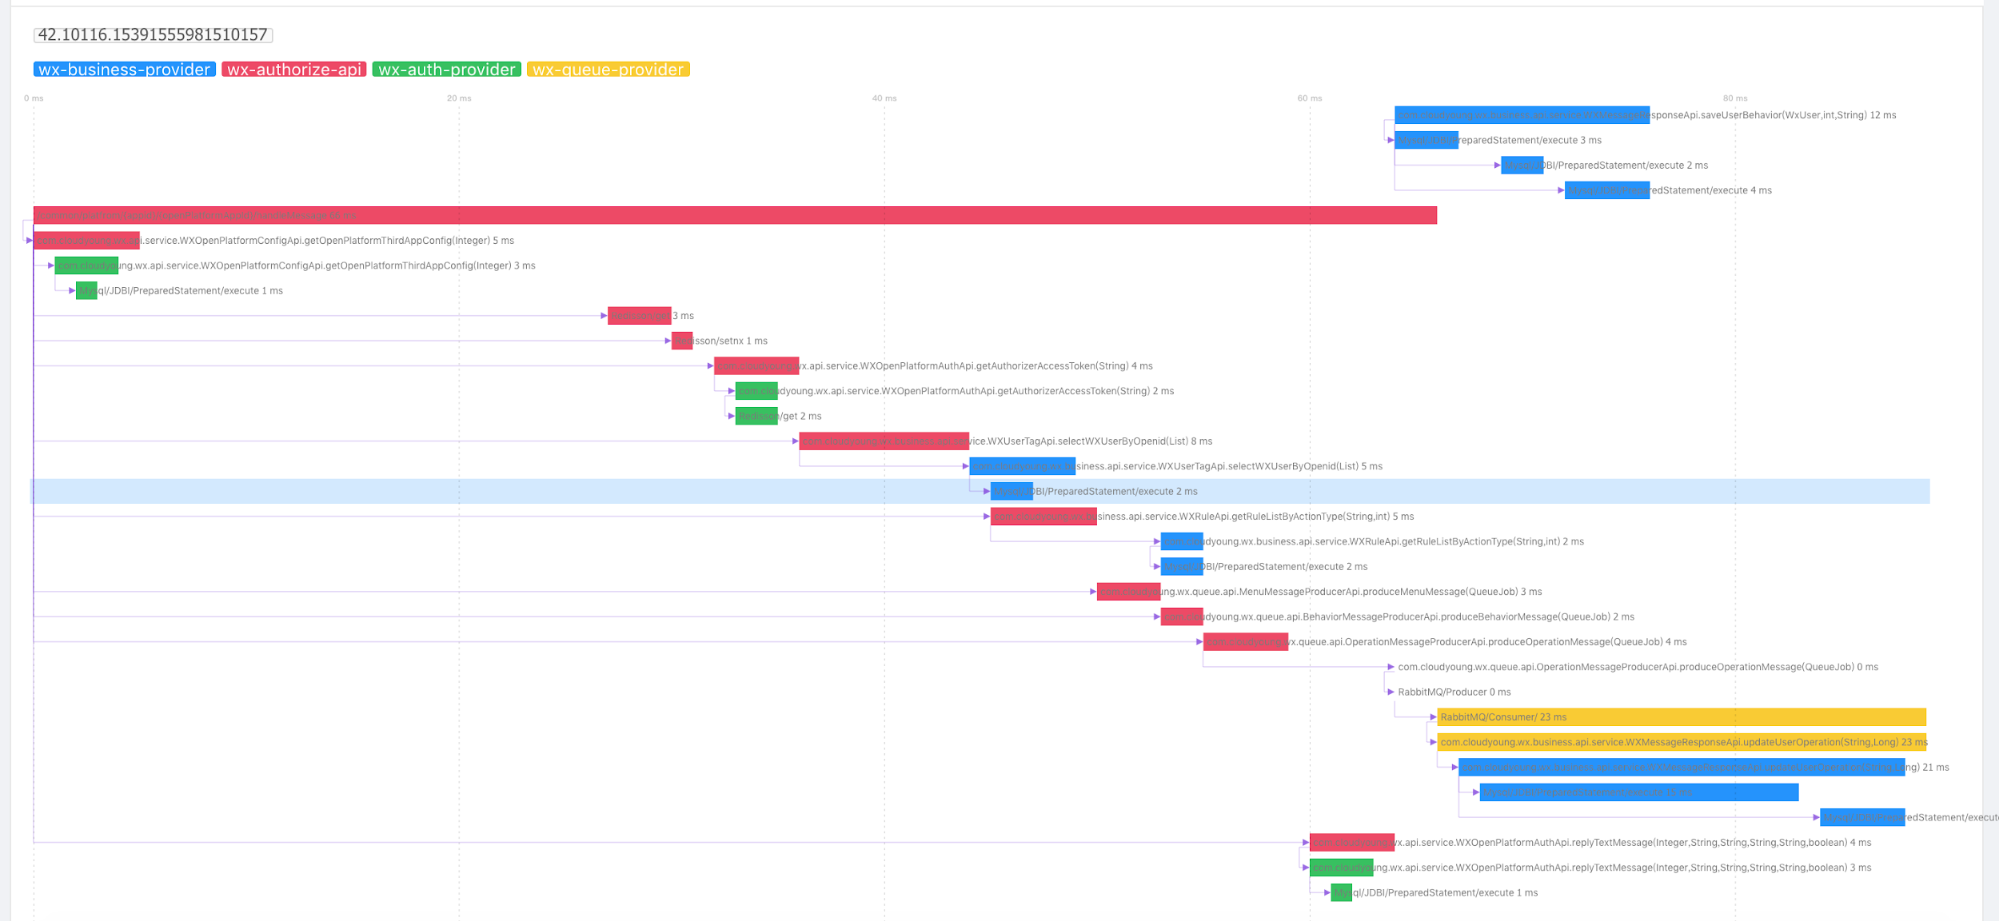
You could find a variety of elements in it just like web service, local method, database, cache, MQ and so on. But service mesh only collect service network telemetry data that contains the entrance and exit data of a service for now(more elements will be imported soon, just like Database). A smaller quantity of data is sent to the service mesh receiver than the trace.
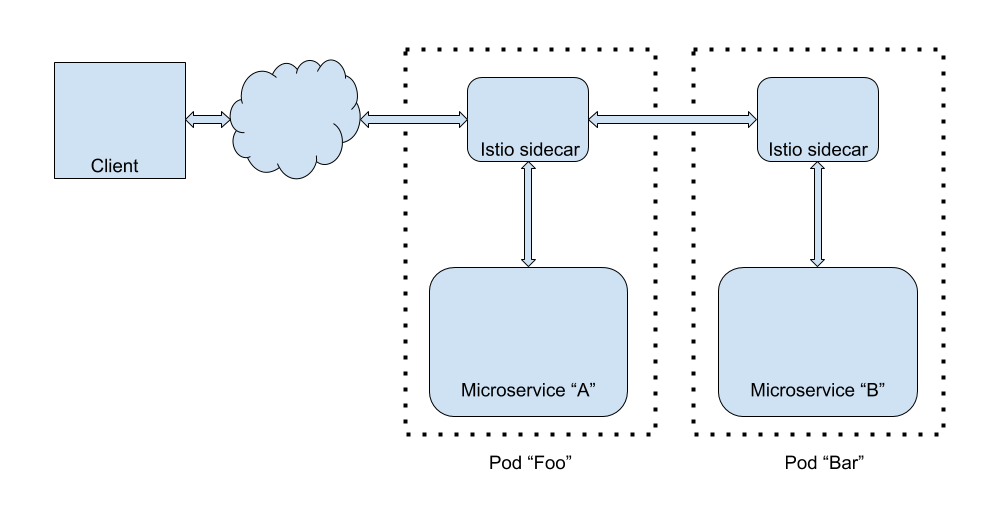
But using sidecar is a little different.The client requesting “A” that will send a segment to service mesh receiver from “A”’s sidecar. If “A” depends on “B”, another segment will be sent from “A”’s sidecar. But for a trace system, only one segment is received by the collector. The sidecar model splits one segment into small segments, that will increase service mesh receiver network overhead.
Deployment Architecture
In this test, I will pick two different backend deployment. One is called mini unit, consist of one collector and one elasticsearch instance. Another is a standard production cluster, contains three collectors and three elasticsearch instances.
Mini unit is a suitable architecture for dev or test environment. It saves your time and VM resources, speeds up depolyment process.
The standard cluster provides good performance and HA for a production scenario. Though you will pay more money and take care of the cluster carefully, the reliability of the cluster will be a good reward to you.
I pick 8 CPU and 16GB VM to set up the test environment. This test targets the performance of normal usage scenarios, so that choice is reasonable. The cluster is built on Google Kubernetes Engine(GKE), and every node links each other with a VPC network. For running collector is a CPU intensive task, the resource request of collector deployment should be 8 CPU, which means every collector instance occupy a VM node.
Testing Process
Receiving mesh fragments per second(MPS) depends on the following variables.
- Ingress query per second(QPS)
- The topology of a microservice cluster
- Service mesh mode(proxy or sidecar)
In this test, I use Bookinfo app as a demo cluster.
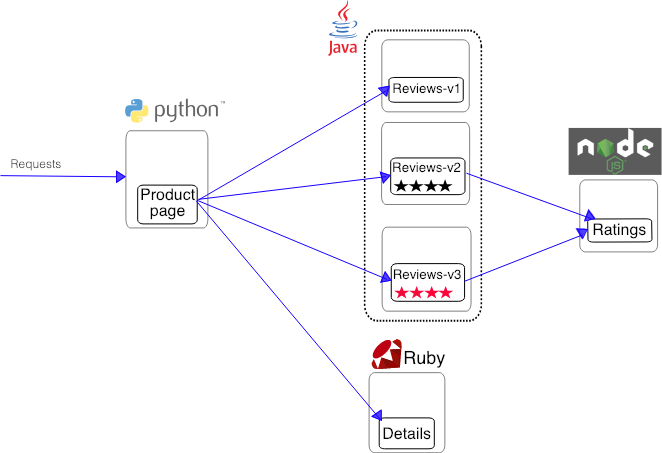
So every request will touch max 4 nodes. Plus picking the sidecar mode(every request will send two telemetry data), the MPS will be QPS * 4 *2.
There are also some important metrics that should be explained
- Client Query Latency: GraphQL API query response time heatmap.
- Client Mesh Sender: Send mesh segments per second. The total line represents total send amount and the error line is the total number of failed send.
- Mesh telemetry latency: service mesh receiver handling data heatmap.
- Mesh telemetry received: received mesh telemetry data per second.
Mini Unit
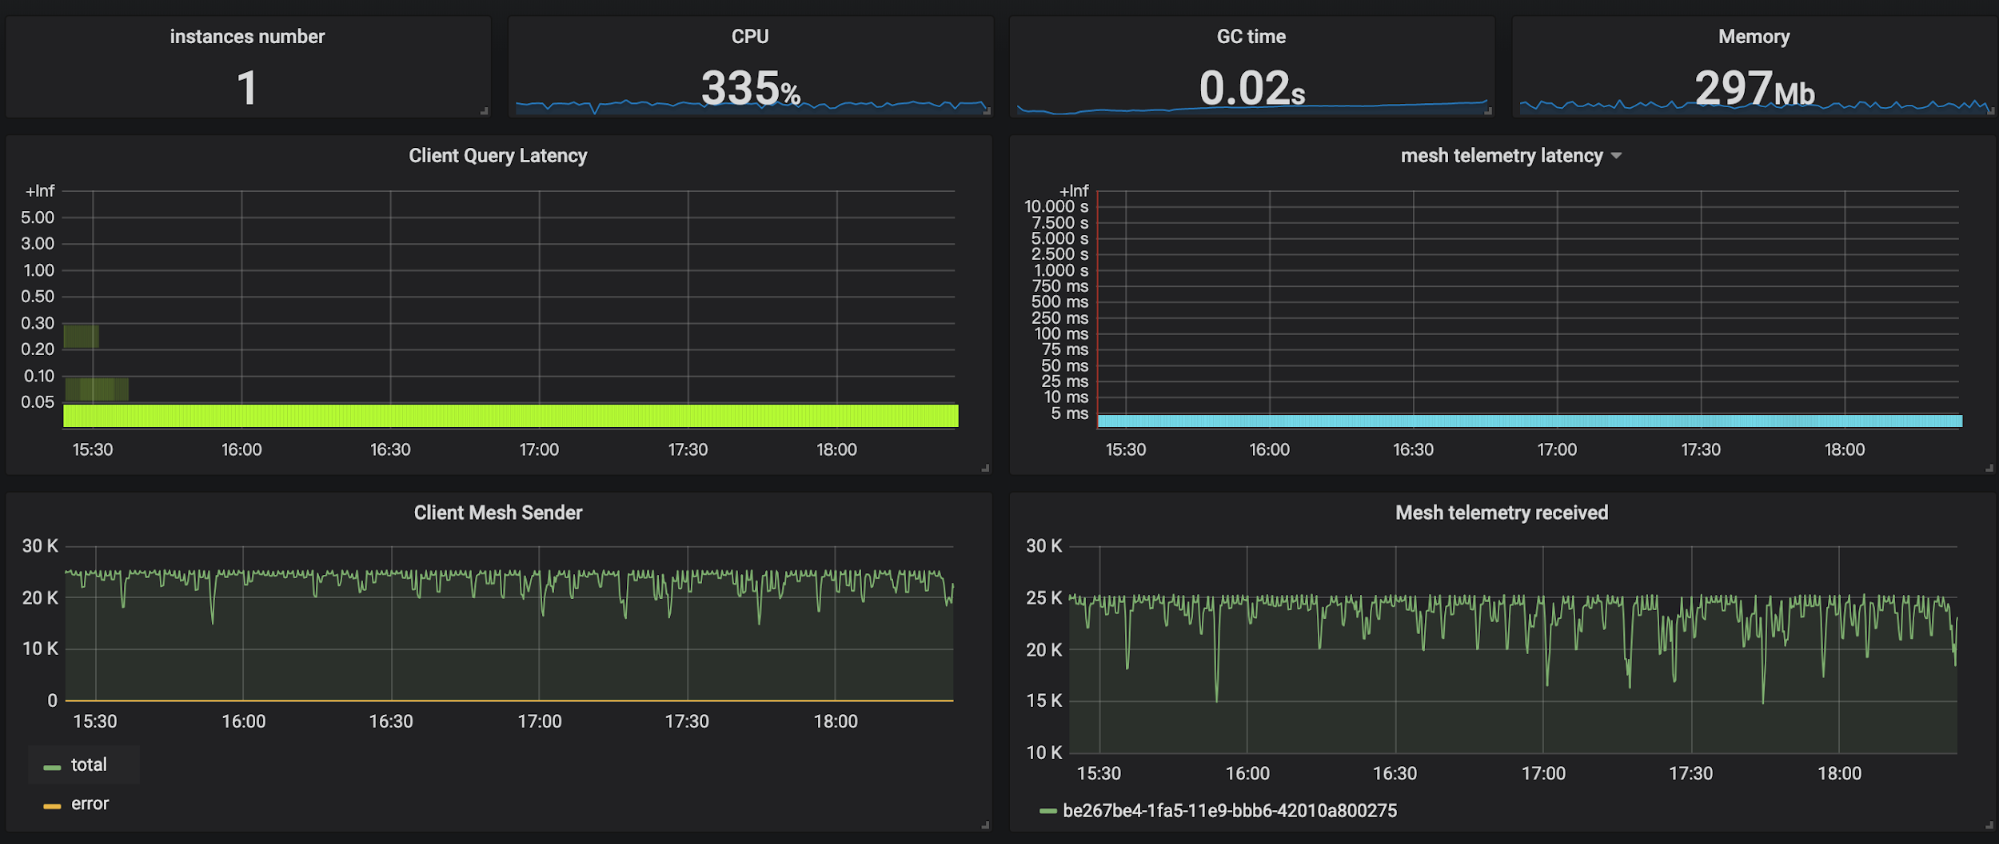
You could find collector can process up to 25k data per second. The CPU usage is about 4 cores. Most of the query latency is less than 50ms. After login the VM on which collector instance running, I know that system load is reaching the limit(max is 8).

According to the previous formula, a single collector instance could process 3k QPS of Bookinfo traffic.
Standard Cluster
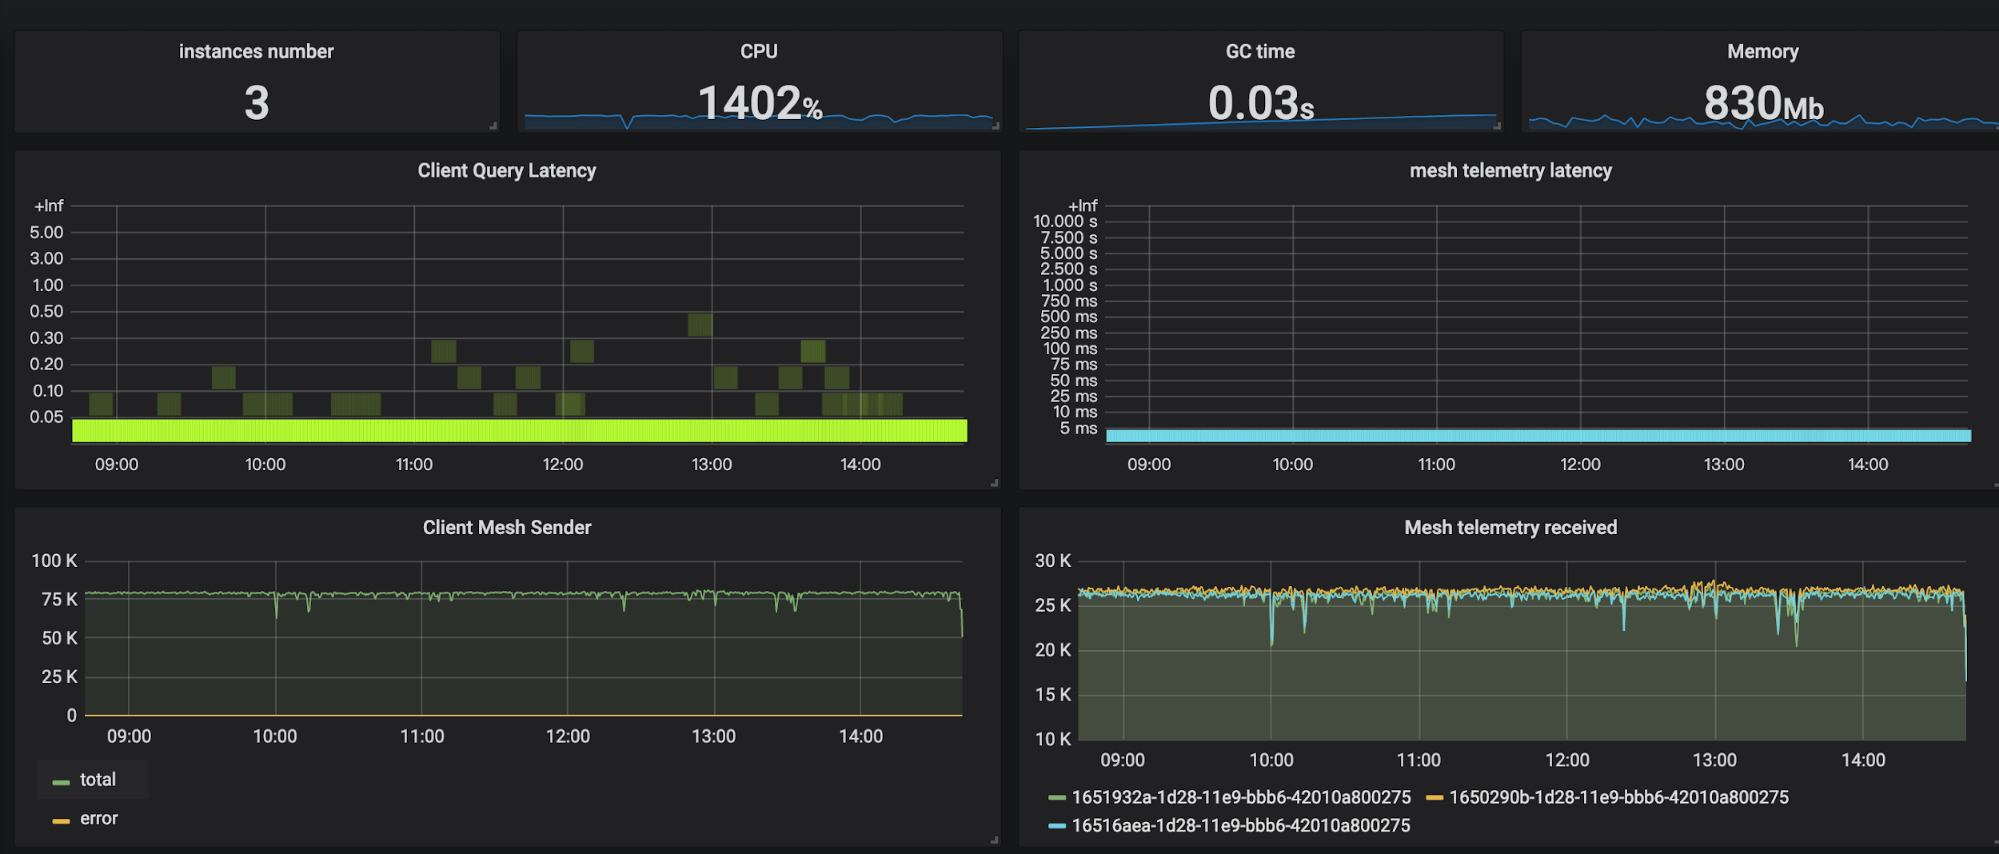
Compare to the mini-unit, cluster’s throughput increases linearly. Three instances provide total 80k per second processing power. Query latency increases slightly, but it’s also very small(less than 500ms). I also checked every collector instance system load that all reached the limit. 10k QPS of BookInfo telemetry data could be processed by the cluster.
Conclusion
Let’s wrap them up. There are some important things you could get from this test.
- QPS varies by the there variables. The test results in this blog are not important. The user should pick property value according to his system.
- Collector cluster’s processing power could scale out.
- The collector is CPU intensive application. So you should provide sufficient CPU resource to it.
This blog gives people a common method to evaluate the throughput of Service Mesh Receiver. Users could use this to design their Apache Skywalking backend deployment architecture.