STAM: Enhancing Topology Auto Detection For A Highly Distributed and Large-Scale Application System
- Sheng Wu 吴 晟
- wusheng@apache.org
Editor’s note
This paper was written by Sheng Wu, project founder, in 2017, to describe the fundamental theory of all current agent core concepts. Readers could learn why SkyWalking agents are significantly different from other tracing system and Dapper[1] Paper’s description.
Abstract
Monitoring, visualizing and troubleshooting a large-scale distributed system is a major challenge. One common tool used today is the distributed tracing system (e.g., Google Dapper)[1], and detecting topology and metrics based on the tracing data. One big limitation of today’s topology detection is that the analysis depends on aggregating the client-side and server-side tracing spans in a given time window to generate the dependency of services. This causes more latency and memory use, because the client and server spans of every RPC must be matched in millions of randomly occurring requests in a highly distributed system. More importantly, it could fail to match if the duration of RPC between client and server is longer than the prior setup time window, or across the two windows.
In this paper, we present the STAM, Streaming Topology Analysis Method. In STAM, we could use auto instrumentation or a manual instrumentation mechanism to intercept and manipulate RPC at both client-side and server-side. In the case of auto instrumentation, STAM manipulates application codes at runtime, such as Java agent. As such, this monitoring system doesn’t require any source code changes from the application development team or RPC framework development team. The STAM injects an RPC network address used at client side, a service name and a service instance name into the RPC context, and binds the server-side service name and service instance name as the alias name for this network address used at the client side. Freeing the dependency analysis from the mechanisms that cause blocking and delay, the analysis core can process the monitoring data in stream mode and generate the accurate topology.
The STAM has been implemented in the Apache SkyWalking[2], an open source APM (application performance monitoring system) project of the Apache Software Foundation, which is widely used in many big enterprises[3] including Alibaba, Huawei, Tencent, Didi, Xiaomi, China Mobile and other enterprises (airlines, financial institutions and others) to support their large-scale distributed systems in the production environment. It reduces the load and memory cost significantly, with better horizontal scale capability.
Introduction
Monitoring the highly distributed system, especially with a micro-service architecture, is very complex. Many RPCs, including HTTP, gRPC, MQ, Cache, and Database accesses, are behind a single client-side request. Allowing the IT team to understand the dependency relationships among thousands of services is the key feature and first step for observability of a whole distributed system. A distributed tracing system is capable of collecting traces, including all distributed request paths. Dependency relationships have been logically included in the trace data. A distributed tracing system, such as Zipkin [4] or Jaeger Tracing [10], provides built-in dependency analysis features, but many analysis features build on top of that. There are at least two fundamental limitations: timeliness and consistent accuracy.
Strong timeliness is required to match the mutability of distributed application system dependency relationship, including service level and service instance level dependency.
A Service is a logic group of instances which have the same functions or codes.
A Service Instance is usually an OS level process, such as a JVM process. The relationships between services and instances are mutable, depending on the configuration, codes and network status. The dependency could change over time.
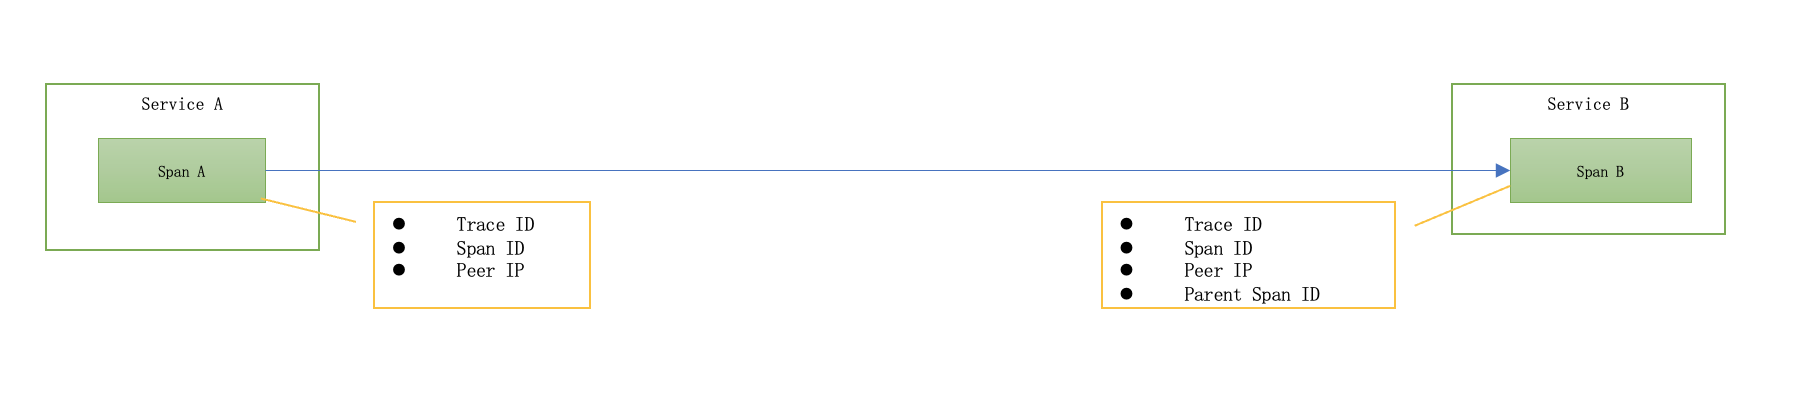
Figure 1, Generated spans in traditional Dapper based tracing system.
The span model in the Dapper paper and existing tracing systems,such as Zipkin instrumenting mode[9], just propagates the span id to the server side. Due to this model, dependency analysis requires a certain time window. The tracing spans are collected at both client- and server-sides, because the relationship is recorded. Due to that, the analysis process has to wait for the client and server spans to match in the same time window, in order to output the result, Service A depending on Service B. So, this time window must be over the duration of this RPC request; otherwise, the conclusion will be lost. This condition makes the analysis would not react the dependency mutation in second level, in production, it sometimes has to set the window duration in 3-5 mins. Also, because of the Windows-based design, if one side involves a long duration task, it can’t easily achieve consistent accuracy. Because in order to make the analysis as fast as possible, the analysis period is less than 5 minutes. But some spans can’t match its parent or children if the analysis is incomplete or crosses two time windows. Even if we added a mechanism to process the spans left in the previous stages, still some would have to be abandoned to keep the dataset size and memory usage reasonable.
In the STAM, we introduce a new span and context propagation models, with the new analysis method. These new models add the peer network address (IP or hostname) used at client side, client service instance name and client service name, into the context propagation model. Then it passes the RPC call from client to server, just as the original trace id and span id in the existing tracing system, and collects it in the server-side span. The new analysis method can easily generate the client-server relationship directly without waiting on the client span. It also sets the peer network address as one alias of the server service. After the across cluster node data sync, the client-side span analysis could use this alias metadata to generate the client-server relationship directly too. By using these new models and method in Apache SkyWalking, we remove the time windows-based analysis permanently, and fully use the streaming analysis mode with less than 5 seconds latency and consistent accuracy
New Span Model and Context Model
The traditional span of a tracing system includes the following fields [1][6][10].
- A trace id to represent the whole trace.
- A span id to represent the current span.
- An operation name to describe what operation this span did.
- A start timestamp.
- A finish timestamp
- Service and Service Instance names of current span.
- A set of zero or more key:value Span Tags.
- A set of zero or more Span Logs, each of which is itself a key:value map paired with a timestamp.
- References to zero or more causally related Spans. Reference includes the parent span id and trace id.
In the new span model of STAM we add the following fields in the span.
Span type. Enumeration, including exit, local and entry. Entry and Exit spans are used in a networking related library. Entry spans represent a server-side networking library, such as Apache Tomcat[7]. Exit spans represent the client-side networking library, such as Apache HttpComponents [8].
Peer Network Address. Remote “address,” suitable for use in exit and entry spans. In Exit spans, the peer network address is the address by the client library to access the server.
These fields usually are optionally included in many tracing system,. But in STAM, we require them in all RPC cases.
Context Model is used to propagate the client-side information to server-side carried by the original RPC call, usually in the header, such as HTTP header or MQ header. In the old design, it carries the trace id and span id of client-side span. In the STAM, we enhance this model, adding the parent service name, parent service instance name and peer of exit span. The names could be literal strings. All these extra fields will help to remove the block of streaming analysis. Compared to the existing context model, this uses a little more bandwidth, but it could be optimized. In Apache SkyWalking, we design a register mechanism to exchange unique IDs to represent these names. As a result, only 3 integers are added in the RPC context, so the increase of bandwidth is at least less than 1% in the production environment.
The changes of two models could eliminate the time windows in the analysis process. Server-side span analysis enhances the context aware capability.
New Topology Analysis Method
The new topology analysis method at the core of STAM is processing the span in stream mode. The analysis of the server-side span, also named entry span, includes the parent service name, parent service instance name and peer of exit span. So the analysis process could establish the following results.
- Set the peer of exit span as client using alias name of current service and instance.
Peer network address <-> service nameandpeer network address <-> Service instance namealiases created. These two will sync with all analysis nodes and persistent in the storage, allowing more analysis processers to have this alias information. - Generate relationships of
parent service name -> current service nameandparent service instance name -> current service instance name, unless there is another differentPeer network address <-> Service Instance Namemapping found. In that case, only generate relationships ofpeer network address <-> service nameandpeer network address <-> Service instance name.
For analysis of the client-side span (exit span), there could three possibilities.
- The peer in the exit span already has the alias names established by server-side span analysis from step (1). Then use alias names to replace the peer, and generate traffic of
current service name -> alias service nameandcurrent service instance name -> alias service instance name. - If the alias could not be found, then just simply generate traffic for
current service name -> peerandcurrent service instance name -> peer. - If multiple alias names of
peer network address <-> Service Instance Namecould be found, then keep generating traffic forcurrent service name -> peer network addressandcurrent service instance name -> peer network address.
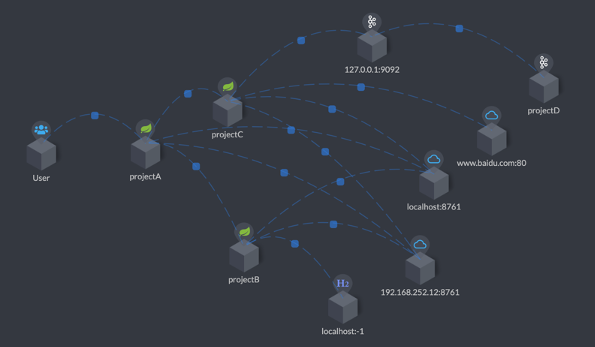
Figure 2, Apache SkyWalking uses STAM to detect and visualize the topology of distributed systems.
Evaluation
In this section, we evaluate the new models and analysis method in the context of several typical cases in which the old method loses timeliness and consistent accuracy.
- 1.New Service Online or Auto Scale Out
New services could be added into the whole topology by the developer team randomly, or container operation platform automatically by some scale out policy, like Kubernetes [5]. The monitoring system could not be notified in any case manually. By using STAM, we could detect the new node automatically and also keep the analysis process unblocked and consistent with detected nodes. In this case, a new service and network address (could be IP, port or both) are used. The peer network address <-> service mapping does not exist, the traffic of client service -> peer network address will be generated and persistent in the storage first. After mapping is generated, further traffic of client-service to server-service could be identified, generated and aggregated in the analysis platform. For filling the gap of a few traffic before the mapping generated, we require doing peer network address <-> service mapping translation again in query stage, to merge client service->peer network address and client-service to server-service. In production, the amount of VM for the whole SkyWalking analysis platform deployment is less than 100, syncing among them will finish less than 10 seconds, in most cases it only takes 3-5 seconds. And in the query stage, the data has been aggregated in minutes or seconds at least. The query merge performance is not related to how much traffic happens before the mapping generated, only affected by sync duration, in here, only 3 seconds. Due to that, in minute level aggregation topology, it only adds 1 or 2 relationship records in the whole topology relationship dataset. Considering an over 100 services topology having over 500 relationship records per minute, the payload increase for this query merge is very limited and affordable. This feature is significant in a large and high load distributed system, as we don’t need to concern its scaling capability. And in some fork versions, they choose to update the existing client service->peer network address to client-service to server-service after detecting the new mapping for peer generated, in order to remove the extra load at query stage permanently.
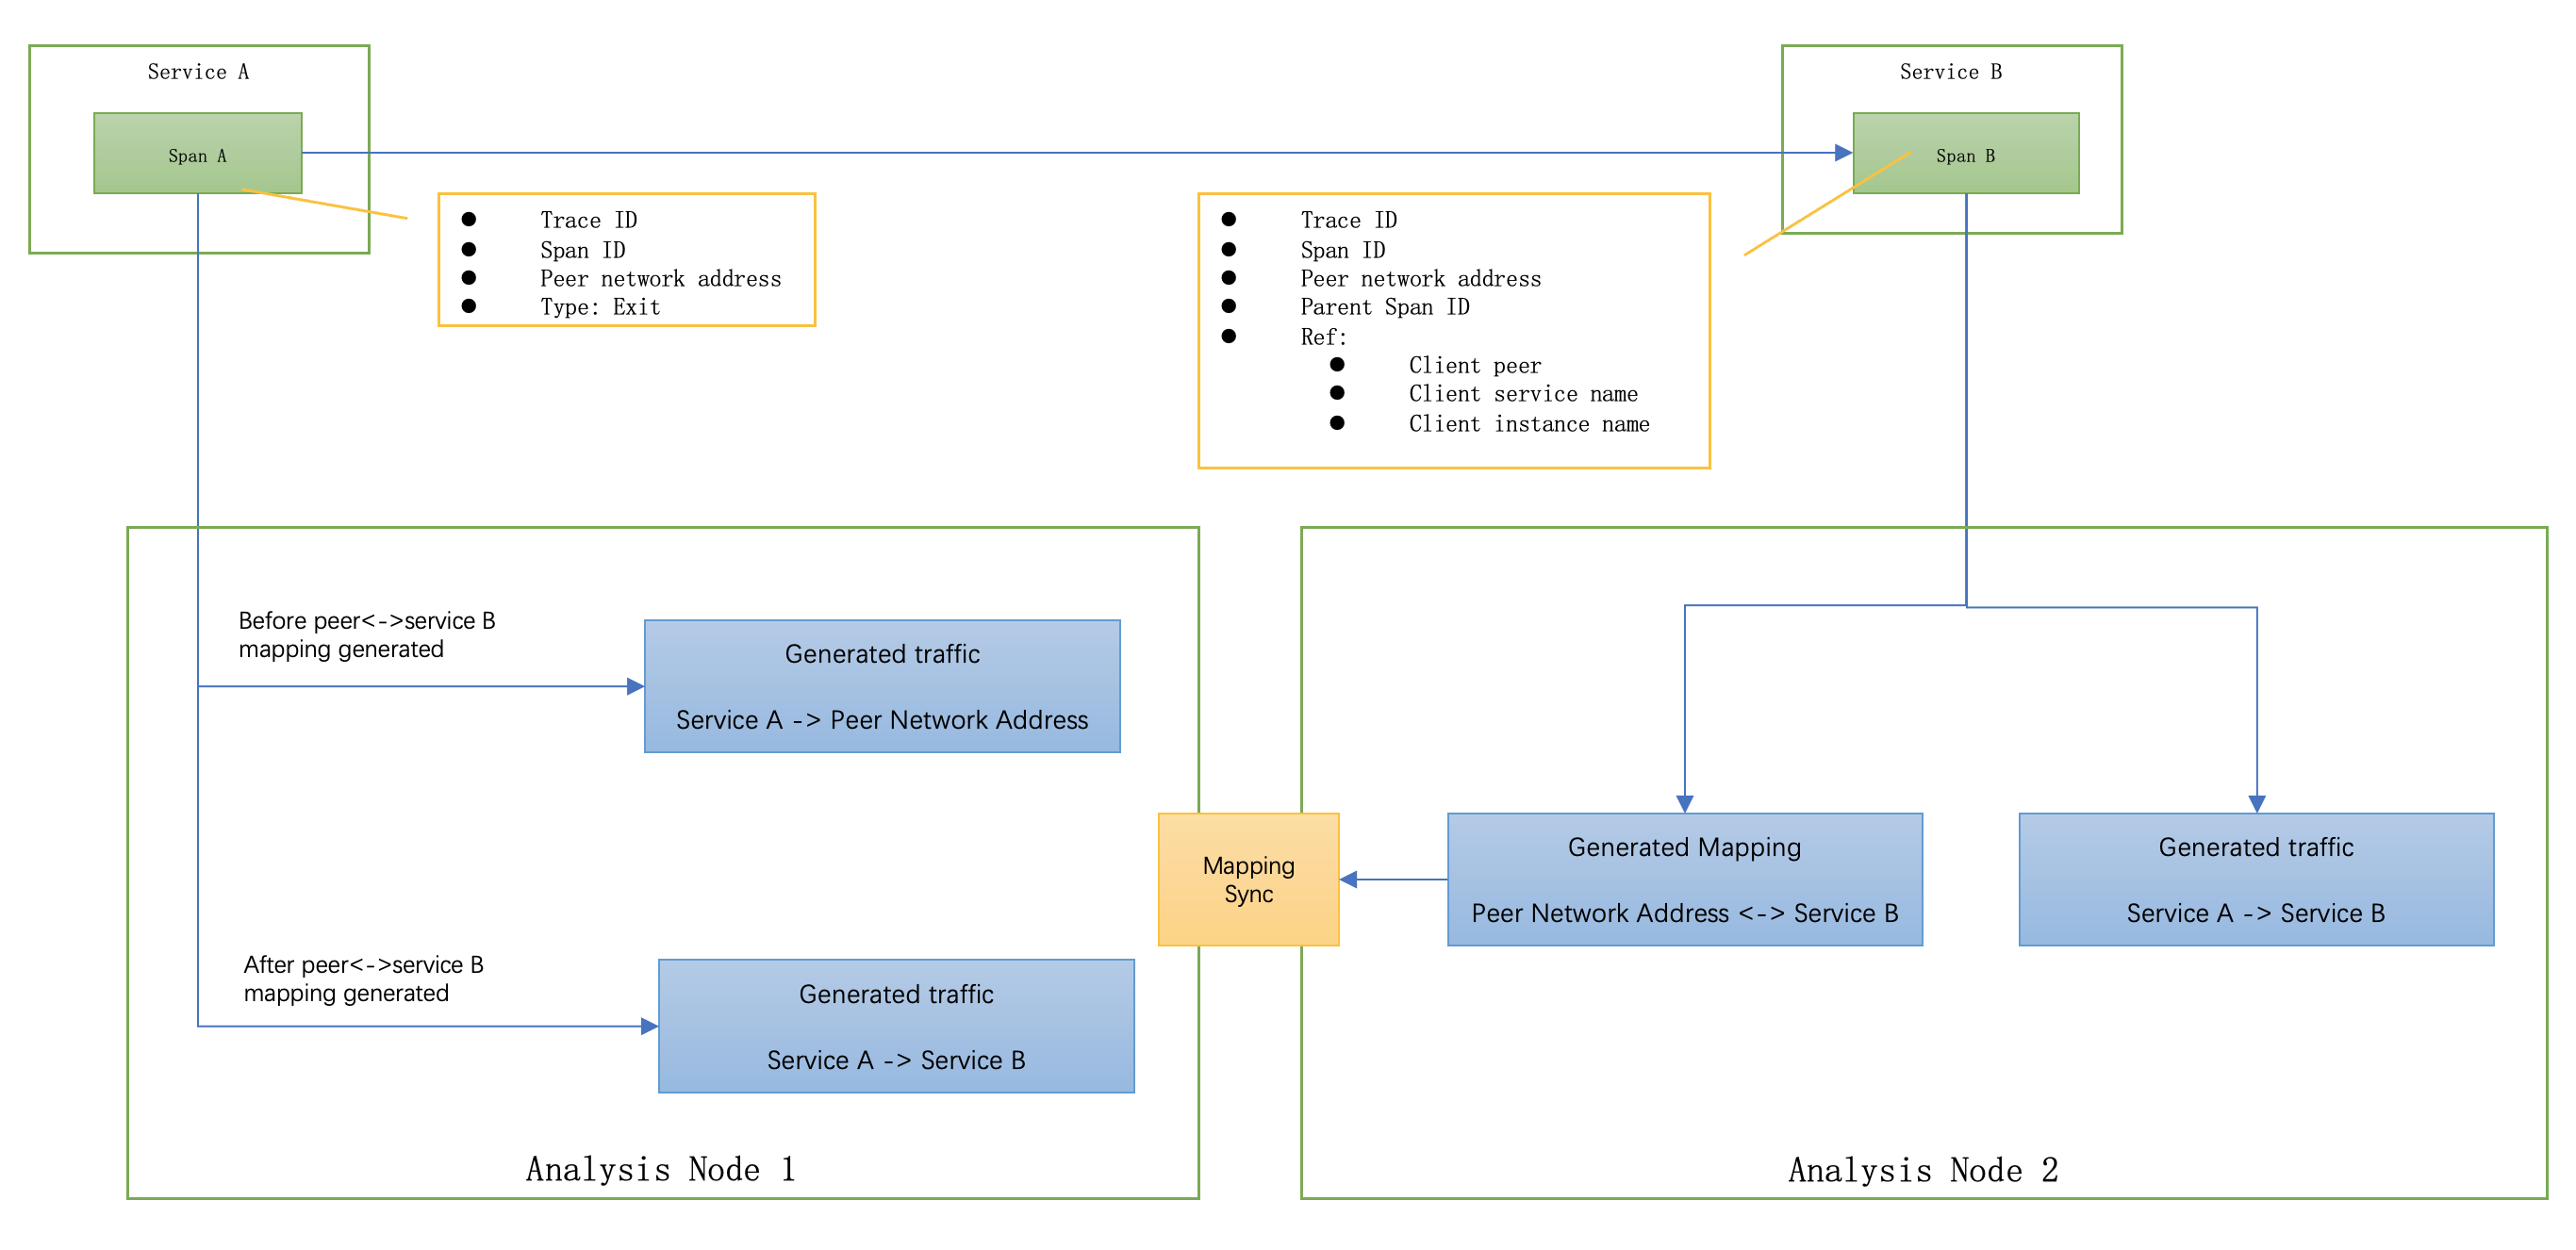
Figure 3, Span analysis by using the new topology analysis method
- 2.Existing Uninstrumented Nodes
Every topology detection method has to work in this case. In many cases, there are nodes in the production environment that can’t be instrumented. Causes for this might include:(1) Restriction of the technology. In some golang or C++ written applications, there is no easy way in Java or .Net to do auto instrumentation by the agent. So, the codes may not be instrumented automatically. (2) The middleware, such as MQ, database server, has not adopted the tracing system. This would make it difficult or time consuming to implement the middleware instrumentation. (3) A 3rd party service or cloud service doesn’t support work with the current tracing system. (4) Lack of resources: e.g., the developer or operation team lacks time to make the instrumentation ready.
The STAM works well even if the client or server side has no instrumentation. It still keeps the topology as accurate as possible.
If the client side hasn’t instrumented, the server-side span wouldn’t get any reference through RPC context, so, it would simply use peer to generate traffic, as shown in Figure 4.
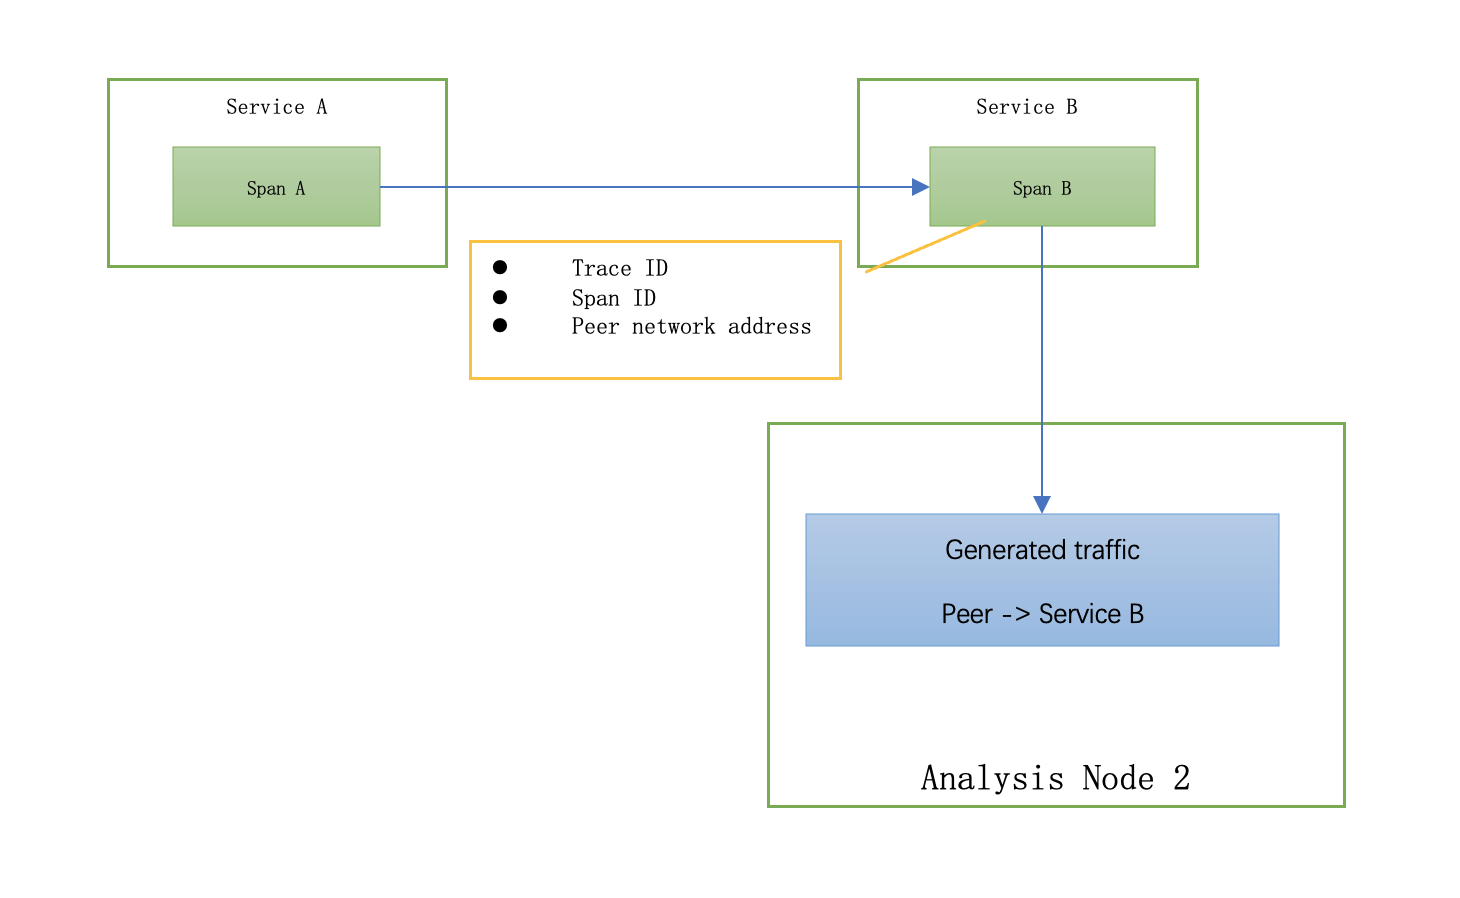
Figure 4, STAM traffic generation when no client-side instrumentation
As shown in Figure 5, in the other case, with no server-side instrumentation, the client span analysis doesn’t need to process this case. The STAM analysis core just simply keeps generating client service->peer network address traffic. As there is no mapping for peer network address generated, there is no merging.
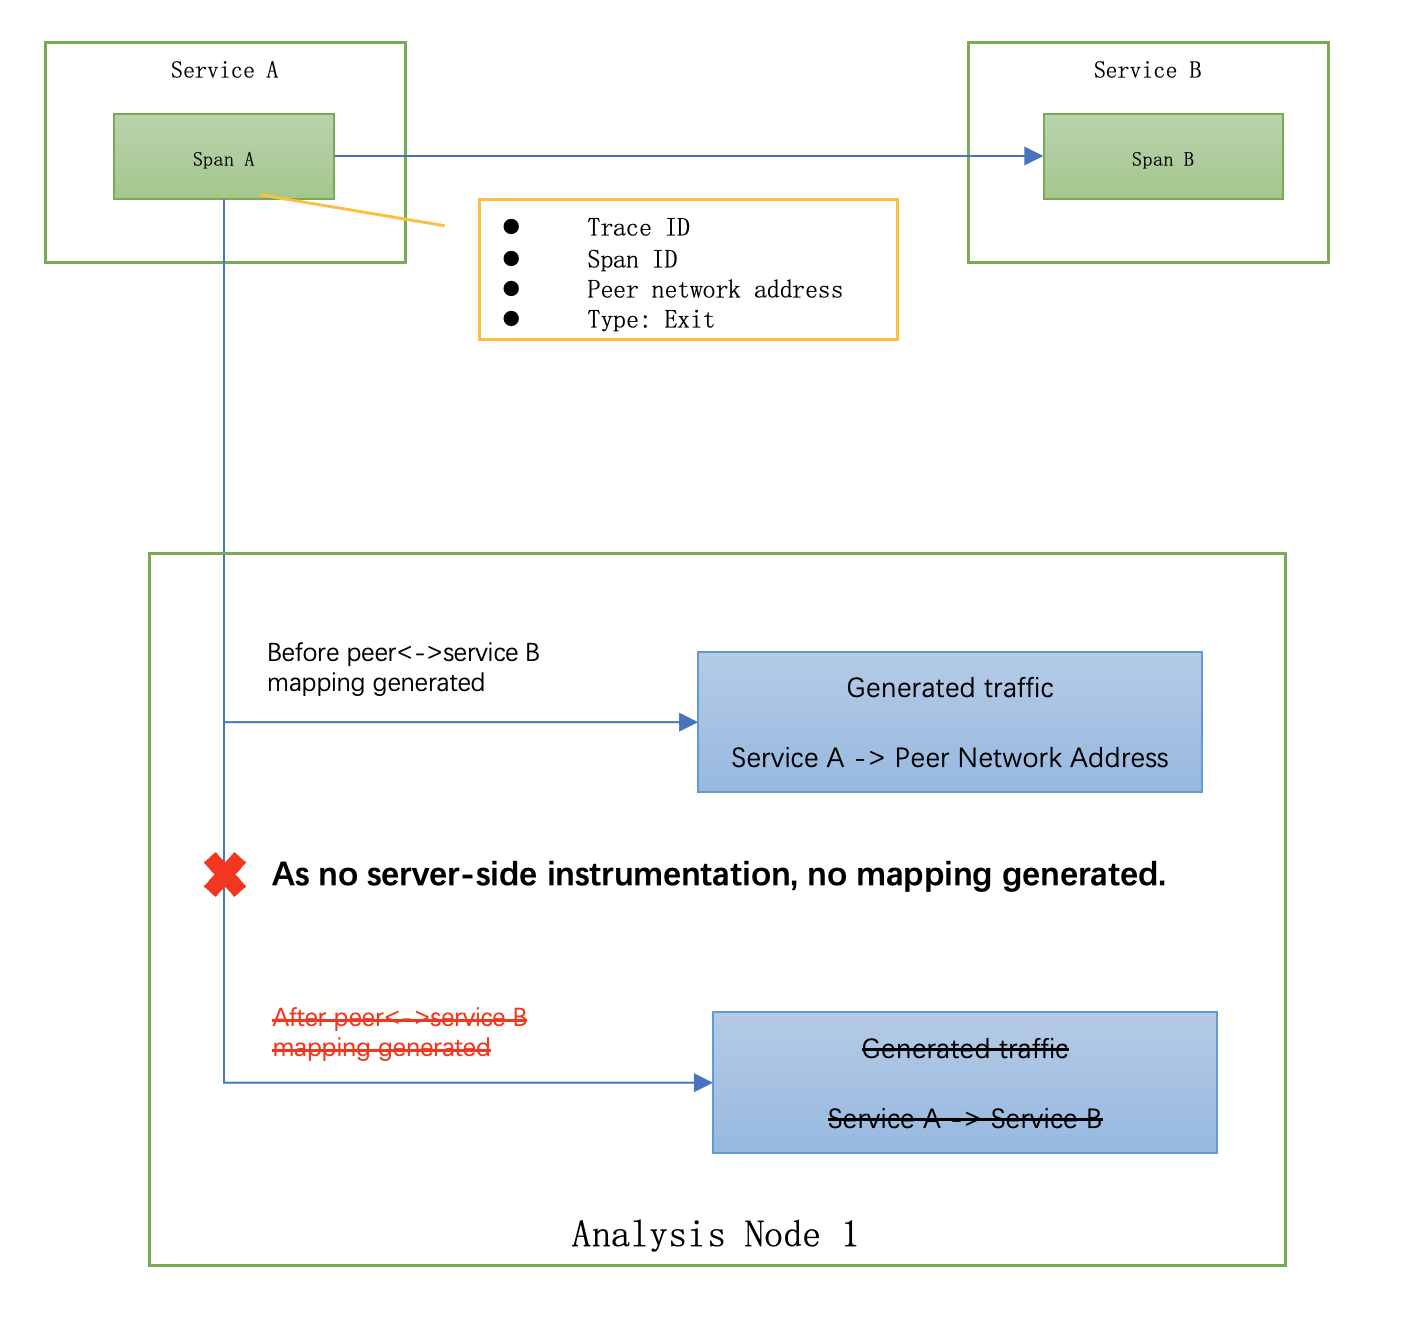
Figure 5, STAM traffic generation when no server-side instrumentation
- 3.Uninstrumented Node Having Header Forward Capability
Besides the cases we evaluated in (2) Uninstrumented Nodes, there is one complex and special case: the instrumented node has the capability to propagate the header from downstream to upstream, typically in all proxy, such as Envoy[11], Nginx[12], Spring Cloud Gateway[13]. As proxy, it has the capability to forward all headers from downstream to upstream to keep some of information in the header, including the tracing context, authentication, browser information, and routing information, in order to make them accessible by the business services behind the proxy, like Envoy route configuration [14]. When some proxy can’t be instrumented, no matter what the reason, it should not affect the topology detection.
In this case, the proxy address would be used at the client side and propagate through RPC context as peer network address, and the proxy forwards this to different upstream services. Then STAM could detect this case and generate the proxy as a conjectural node. In the STAM, more than one alias names for this network address should be generated. After those two are detected and synchronized to the analysis node, the analysis core knows there is at least one uninstrumented service standing between client and servers. So, it will generate the relationships of client service->peer network address, peer->server service B and peer network address ->server service C, as shown in Figure 6.
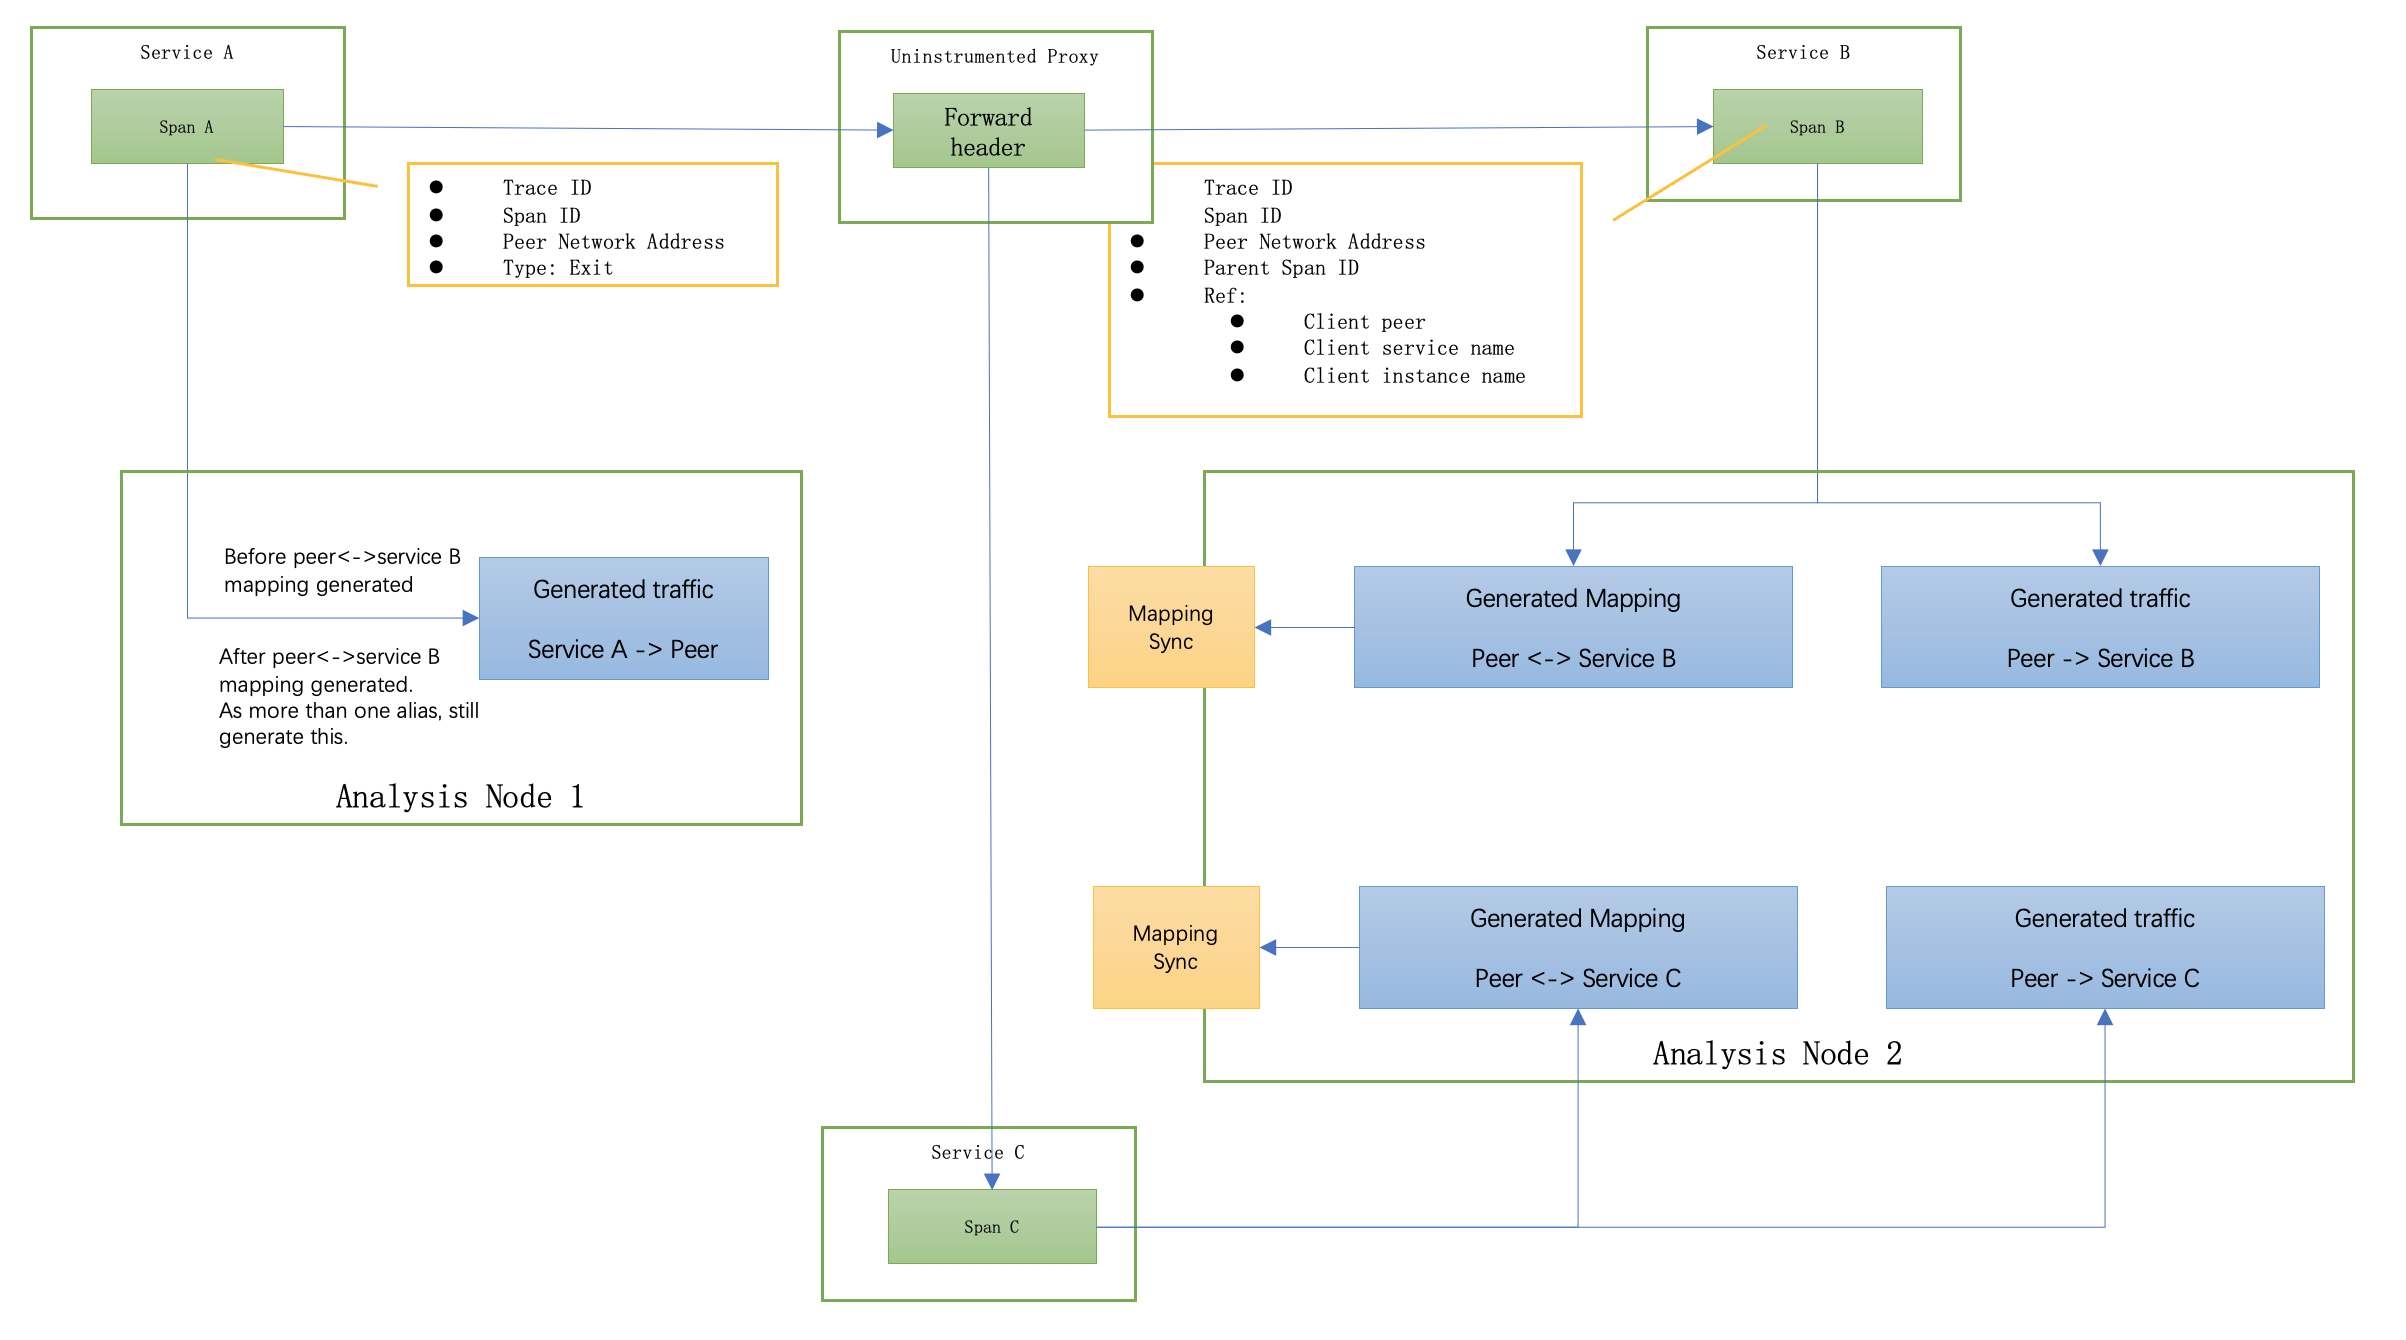
Figure 6, STAM traffic generation when the proxy uninstrumentatio
Conclusion
This paper described the STAM, which is to the best of our knowledge the best topology detection method for distributed tracing systems. It replaces the time-window based topology analysis method for tracing-based monitoring systems. It removes the resource cost of disk and memory for time-window baseds analysis permanently and totally, and the barriers of horizontal scale. One STAM implementation, Apache SkyWalking, is widely used for monitoring hundreds of applications in production. Some of them generated over 100 TB tracing data per day and topology for over 200 services in real time.
Acknowledgments
We thank all contributors of Apache SkyWalking project for suggestions, code contributions to implement the STAM, and feedback from using the STAM and SkyWalking in their production environment.
License
This paper and the STAM are licensed in the Apache 2.0.
References
- Dapper, a Large-Scale Distributed Systems Tracing Infrastructure, https://research.google.com/pubs/pub36356.html?spm=5176.100239.blogcont60165.11.OXME9Z
- Apache SkyWalking, http://skywalking.apache.org/
- Apache Open Users, https://skywalking.apache.org/users/
- Zipkin, https://zipkin.io/
- Kubernetes, Production-Grade Container Orchestration. Automated container deployment, scaling, and management. https://kubernetes.io/
- OpenTracing Specification https://github.com/opentracing/specification/blob/master/specification.md
- Apache Tomcat, http://tomcat.apache.org/
- Apache HttpComponents, https://hc.apache.org/
- Zipkin doc, ‘Instrumenting a library’ section, ‘Communicating trace information’ paragraph. https://zipkin.io/pages/instrumenting
- Jaeger Tracing, https://jaegertracing.io/
- Envoy Proxy, http://envoyproxy.io/
- Nginx, http://nginx.org/
- Spring Cloud Gateway, https://spring.io/projects/spring-cloud-gateway
- Envoy Route Configuration, https://www.envoyproxy.io/docs/envoy/latest/api-v2/api/v2/rds.proto.html?highlight=request_headers_to_